Siemens 2009 Annual Report Download - page 239
Download and view the complete annual report
Please find page 239 of the 2009 Siemens annual report below. You can navigate through the pages in the report by either clicking on the pages listed below, or by using the keyword search tool below to find specific information within the annual report.-
 1
1 -
2
-
3
-
4
-
5
-
6
-
7
-
8
-
9
-
10
-
11
-
12
-
13
-
14
-
15
-
16
-
17
-
18
-
19
-
20
-
21
-
22
-
23
-
24
-
25
-
26
-
27
-
28
-
29
-
30
-
31
-
32
-
33
-
34
-
35
-
36
-
37
-
38
-
39
-
40
-
41
-
42
-
43
-
44
-
45
-
46
-
47
-
48
-
49
-
50
-
51
-
52
-
53
-
54
-
55
-
56
-
57
-
58
-
59
-
60
-
61
-
62
-
63
-
64
-
65
-
66
-
67
-
68
-
69
-
70
-
71
-
72
-
73
-
74
-
75
-
76
-
77
-
78
-
79
-
80
-
81
-
82
-
83
-
84
-
85
-
86
-
87
-
88
-
89
-
90
-
91
-
92
-
93
-
94
-
95
-
96
-
97
-
98
-
99
-
100
-
101
-
102
-
103
-
104
-
105
-
106
-
107
-
108
-
109
-
110
-
111
-
112
-
113
-
114
-
115
-
116
-
117
-
118
-
119
-
120
-
121
-
122
-
123
-
124
-
125
-
126
-
127
-
128
-
129
-
130
-
131
-
132
-
133
-
134
-
135
-
136
-
137
-
138
-
139
-
140
-
141
-
142
-
143
-
144
-
145
-
146
-
147
-
148
-
149
-
150
-
151
-
152
-
153
-
154
-
155
-
156
-
157
-
158
-
159
-
160
-
161
-
162
-
163
-
164
-
165
-
166
-
167
-
168
-
169
-
170
-
171
-
172
-
173
-
174
-
175
-
176
-
177
-
178
-
179
-
180
-
181
-
182
-
183
-
184
-
185
-
186
-
187
-
188
-
189
-
190
-
191
-
192
-
193
-
194
-
195
-
196
-
197
-
198
-
199
-
200
-
201
-
202
-
203
-
204
-
205
-
206
-
207
-
208
-
209
-
210
-
211
-
212
-
213
-
214
-
215
-
216
-
217
-
218
-
219
-
220
-
221
-
222
-
223
-
224
-
225
-
226
-
227
-
228
-
 229
229 -
 230
230 -
 231
231 -
 232
232 -
 233
233 -
 234
234 -
 235
235 -
 236
236 -
 237
237 -
 238
238 -
 239
239 -
 240
240 -
 241
241 -
 242
242 -
 243
243 -
 244
244 -
 245
245 -
 246
246 -
 247
247 -
 248
248 -
 249
249 -
250
-
251
-
252
-
253
-
254
-
255
-
256
-
257
-
258
-
259
-
260
-
261
-
262
-
263
-
264
-
265
-
266
-
267
-
268
-
269
-
270
-
271
-
272
-
273
-
274
-
275
-
276
-
277
-
278
-
279
-
280
-
281
-
282
-
283
-
284
-
285
-
286
-
287
-
288
-
289
-
290
-
291
-
292
-
293
-
294
-
295
-
296
-
297
-
298
-
299
-
300
-
301
-
302
-
303
-
304
-
305
-
306
-
307
-
308
-
309
-
310
-
311
-
312
-
313
-
314
-
315
-
316
-
317
-
318
-
319
-
320
-
321
-
322
 |
 |

Managing Board statements, Independent auditors’ report, Additional information
Notes to Consolidated Financial Statements
(in millions of €, except where otherwise
stated and per share amounts)
Among the above mentioned divisions, Healthcare’s Diagnos-
tics division has the highest amount of goodwill and the low-
est excess of the recoverable amount over the carrying amount
(the headroom). Diagnostics’ headroom was estimated at
€2,284. Diagnostics is based on the acquisitions of Diagnostic
Products Corporation (DPC), the Diagnostics division of Bayer
AG, and the acquisition of Dade Behring, Inc. The division op-
erates in the global healthcare market for diagnostic testing
systems and consumables which faces increasing cost re-
straints and is estimated to represent a growing market mainly
in conjunction with the “megatrend” demographic change.
Both volume growth and productivity improvements as a re-
sult of integrating those three acquisitions are assumed to
contribute to profit margin improvements in the next years.
The estimated fair value of Diagnostics is assumed to be
mainly driven by volume growth over the next years as well as
by the terminal value. Over the 5-year planning period, a com-
pound annual revenue growth rate of 5 percent was assumed.
Cash flows beyond the 5-year planning period were extrapo-
lated using a constant growth rate of 3 percent. A discount rate
of 7.5 percent was applied.
The headroom would be decreased to zero due to a decrease of
the terminal value growth rate by 1.4 percentage points. A de-
crease of the compound annual growth rate for revenue dur-
ing the 5-year planning period by more than 2.5 percentage
points would reduce the headroom by more than (77) percent.
The headroom would change by (51) percent due to an increase
in the discount rate of 0.5 percentage points.
For the purpose of estimating the fair value less costs to sell of
the divisions, cash flows were projected based on past experi-
ence, actual operating results and management’s best esti-
mate about future developments as well as market assump-
tions.
The Fair value less costs to sell is mainly determined by the
terminal value which is particularly sensitive to changes in the
assumptions on the terminal value growth rate and discount
rate. Both assumptions are determined individually for each
division. Discount rates reflect the current market assessment
of the risks specific to each division and are based on the
weighted average cost of capital for the divisions (for SFS the
discount rate represents cost of equity). Terminal value growth
rates take into consideration external macroeconomic sources
of data.
Based on the annual impairment test in fiscal 2009, the divi-
sions’ recoverable amounts were estimated to be higher than
the carrying amounts, and management did not identify any
impairments.
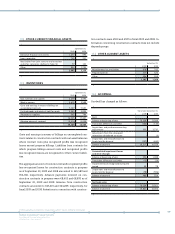
The following table presents the key assumptions used to de-
termine fair value less costs to sell for impairment test pur-
poses, for divisions to which a significant amount of goodwill
is allocated:
Year ended September 30, 2009
Goodwill Terminal
Value
Growth Rate
Discount
Rate
Diagnostics within
Healthcare Sector 5,507 3.0% 7.5%
Imaging & IT within
Healthcare Sector 2,782 3.0% 8.0%
Industry Automation within
Industry Sector 2,250 2.0% 8.0%
B27T034_E
Year ended September ,
Goodwill Terminal
Value
Growth Rate
Discount
Rate
Diagnostics within
Healthcare Sector 6,131 3.0% 8.0%
Imaging & IT within
Healthcare Sector 2,418 3.0% 8.0%
Industry Automation within
Industry Sector 2,259 2.0% 7.5%
B27T035_E