Siemens 2009 Annual Report Download - page 210
Download and view the complete annual report
Please find page 210 of the 2009 Siemens annual report below. You can navigate through the pages in the report by either clicking on the pages listed below, or by using the keyword search tool below to find specific information within the annual report.-
 1
1 -
2
-
3
-
4
-
5
-
6
-
7
-
8
-
9
-
10
-
11
-
12
-
13
-
14
-
15
-
16
-
17
-
18
-
19
-
20
-
21
-
22
-
23
-
24
-
25
-
26
-
27
-
28
-
29
-
30
-
31
-
32
-
33
-
34
-
35
-
36
-
37
-
38
-
39
-
40
-
41
-
42
-
43
-
44
-
45
-
46
-
47
-
48
-
49
-
50
-
51
-
52
-
53
-
54
-
55
-
56
-
57
-
58
-
59
-
60
-
61
-
62
-
63
-
64
-
65
-
66
-
67
-
68
-
69
-
70
-
71
-
72
-
73
-
74
-
75
-
76
-
77
-
78
-
79
-
80
-
81
-
82
-
83
-
84
-
85
-
86
-
87
-
88
-
89
-
90
-
91
-
92
-
93
-
94
-
95
-
96
-
97
-
98
-
99
-
100
-
101
-
102
-
103
-
104
-
105
-
106
-
107
-
108
-
109
-
110
-
111
-
112
-
113
-
114
-
115
-
116
-
117
-
118
-
119
-
120
-
121
-
122
-
123
-
124
-
125
-
126
-
127
-
128
-
129
-
130
-
131
-
132
-
133
-
134
-
135
-
136
-
137
-
138
-
139
-
140
-
141
-
142
-
143
-
144
-
145
-
146
-
147
-
148
-
149
-
150
-
151
-
152
-
153
-
154
-
155
-
156
-
157
-
158
-
159
-
160
-
161
-
162
-
163
-
164
-
165
-
166
-
167
-
168
-
169
-
170
-
171
-
172
-
173
-
174
-
175
-
176
-
177
-
178
-
179
-
180
-
181
-
182
-
183
-
184
-
185
-
186
-
187
-
188
-
189
-
190
-
191
-
192
-
193
-
194
-
195
-
196
-
197
-
198
-
199
-
 200
200 -
 201
201 -
 202
202 -
 203
203 -
 204
204 -
 205
205 -
 206
206 -
 207
207 -
 208
208 -
 209
209 -
 210
210 -
 211
211 -
 212
212 -
 213
213 -
 214
214 -
 215
215 -
 216
216 -
 217
217 -
 218
218 -
 219
219 -
 220
220 -
221
-
222
-
223
-
224
-
225
-
226
-
227
-
228
-
229
-
230
-
231
-
232
-
233
-
234
-
235
-
236
-
237
-
238
-
239
-
240
-
241
-
242
-
243
-
244
-
245
-
246
-
247
-
248
-
249
-
250
-
251
-
252
-
253
-
254
-
255
-
256
-
257
-
258
-
259
-
260
-
261
-
262
-
263
-
264
-
265
-
266
-
267
-
268
-
269
-
270
-
271
-
272
-
273
-
274
-
275
-
276
-
277
-
278
-
279
-
280
-
281
-
282
-
283
-
284
-
285
-
286
-
287
-
288
-
289
-
290
-
291
-
292
-
293
-
294
-
295
-
296
-
297
-
298
-
299
-
300
-
301
-
302
-
303
-
304
-
305
-
306
-
307
-
308
-
309
-
310
-
311
-
312
-
313
-
314
-
315
-
316
-
317
-
318
-
319
-
320
-
321
-
322
 |
 |

Reports Supervisory Board /
Managing Board Corporate Governance Management’s discussion and analysis Consolidated Financial Statements
Consolidated Statements of Income Consolidated Statements of Income
and Expense Recognized in Equity
Consolidated Balance Sheets Consolidated Statements of Cash Flow
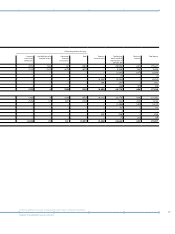
Consolidated Statements of Income
For the fi scal years ended September 30, 2009 and 2008
Fiscal years ended September ,
(in millions of €, per share amounts in €) Note
Revenue 76,651 77,327
Cost of goods sold and services rendered (55,941) (56,284)
Gross profi t 20,710 21,043
Research and development expenses (3,900) (3,784)
Marketing, selling and general administrative expenses (10,896) (13,586)
Other operating income 1,065 1,047
Other operating expense (632) (2,228)
Income (loss) from investments accounted for using the equity method, net (1,946) 260
Financial income (expense), net (510) 122
Income (loss) from continuing operations before income taxes 3,891 2,874
Income taxes (1,434) (1,015)
Income (loss) from continuing operations 2,457 1,859
Income (loss) from discontinued operations, net of income taxes 40 4,027
Net income (loss) 2,497 5,886
Attributable to:
Minority interest 205 161
Shareholders of Siemens AG 2,292 5,725
Basic earnings per share
Income (loss) from continuing operations 2.60 1.91
Income (loss) from discontinued operations 0.05 4.50
Net income (loss) 2.65 6.41
Diluted earnings per share
Income (loss) from continuing operations 2.58 1.90
Income (loss) from discontinued operations 0.05 4.49
Net income (loss) 2.63 6.39
B26T001_E