Siemens 2009 Annual Report Download - page 276
Download and view the complete annual report
Please find page 276 of the 2009 Siemens annual report below. You can navigate through the pages in the report by either clicking on the pages listed below, or by using the keyword search tool below to find specific information within the annual report.-
 1
1 -
2
-
3
-
4
-
5
-
6
-
7
-
8
-
9
-
10
-
11
-
12
-
13
-
14
-
15
-
16
-
17
-
18
-
19
-
20
-
21
-
22
-
23
-
24
-
25
-
26
-
27
-
28
-
29
-
30
-
31
-
32
-
33
-
34
-
35
-
36
-
37
-
38
-
39
-
40
-
41
-
42
-
43
-
44
-
45
-
46
-
47
-
48
-
49
-
50
-
51
-
52
-
53
-
54
-
55
-
56
-
57
-
58
-
59
-
60
-
61
-
62
-
63
-
64
-
65
-
66
-
67
-
68
-
69
-
70
-
71
-
72
-
73
-
74
-
75
-
76
-
77
-
78
-
79
-
80
-
81
-
82
-
83
-
84
-
85
-
86
-
87
-
88
-
89
-
90
-
91
-
92
-
93
-
94
-
95
-
96
-
97
-
98
-
99
-
100
-
101
-
102
-
103
-
104
-
105
-
106
-
107
-
108
-
109
-
110
-
111
-
112
-
113
-
114
-
115
-
116
-
117
-
118
-
119
-
120
-
121
-
122
-
123
-
124
-
125
-
126
-
127
-
128
-
129
-
130
-
131
-
132
-
133
-
134
-
135
-
136
-
137
-
138
-
139
-
140
-
141
-
142
-
143
-
144
-
145
-
146
-
147
-
148
-
149
-
150
-
151
-
152
-
153
-
154
-
155
-
156
-
157
-
158
-
159
-
160
-
161
-
162
-
163
-
164
-
165
-
166
-
167
-
168
-
169
-
170
-
171
-
172
-
173
-
174
-
175
-
176
-
177
-
178
-
179
-
180
-
181
-
182
-
183
-
184
-
185
-
186
-
187
-
188
-
189
-
190
-
191
-
192
-
193
-
194
-
195
-
196
-
197
-
198
-
199
-
200
-
201
-
202
-
203
-
204
-
205
-
206
-
207
-
208
-
209
-
210
-
211
-
212
-
213
-
214
-
215
-
216
-
217
-
218
-
219
-
220
-
221
-
222
-
223
-
224
-
225
-
226
-
227
-
228
-
229
-
230
-
231
-
232
-
233
-
234
-
235
-
236
-
237
-
238
-
239
-
240
-
241
-
242
-
243
-
244
-
245
-
246
-
247
-
248
-
249
-
250
-
251
-
252
-
253
-
254
-
255
-
256
-
257
-
258
-
259
-
260
-
261
-
262
-
263
-
264
-
265
-
 266
266 -
 267
267 -
 268
268 -
 269
269 -
 270
270 -
 271
271 -
 272
272 -
 273
273 -
 274
274 -
 275
275 -
 276
276 -
 277
277 -
 278
278 -
 279
279 -
 280
280 -
 281
281 -
 282
282 -
 283
283 -
 284
284 -
 285
285 -
 286
286 -
287
-
288
-
289
-
290
-
291
-
292
-
293
-
294
-
295
-
296
-
297
-
298
-
299
-
300
-
301
-
302
-
303
-
304
-
305
-
306
-
307
-
308
-
309
-
310
-
311
-
312
-
313
-
314
-
315
-
316
-
317
-
318
-
319
-
320
-
321
-
322
 |
 |
Reports Supervisory Board /
Managing Board Corporate Governance Management’s discussion and analysis Consolidated Financial Statements
Consolidated Statements of Income Consolidated Statements of Income
and Expense Recognized in Equity
Consolidated Balance Sheets Consolidated Statements of Cash Flow
The fair value of quoted notes and bonds is based on price quo-
tations at the balance sheet date. The fair value of unquoted
notes and bonds, loans from banks and other financial indebt-
edness, obligations under finance leases as well as other non-
current financial liabilities is estimated by discounting future
cash flows using rates currently available for debt of similar
terms and remaining maturities.
The fair values of cash and cash equivalents, current receiv-
ables, trade payables, other current financial liabilities and
commercial paper and borrowings under revolving credit facil-
ities approximate their carrying amount largely due to the
short-term maturities of these instruments.
Long-term fixed-rate and variable-rate receivables, including
receivables from finance leases, are evaluated by the Company
based on parameters such as interest rates, specific country
risk factors, individual creditworthiness of the customer and
the risk characteristics of the financed project. Based on this
evaluation, allowances are taken to account for the expected
losses of these receivables. As of September 30, 2009 and
2008, the carrying amounts of such receivables, net of allow-
ances, approximate their fair values.
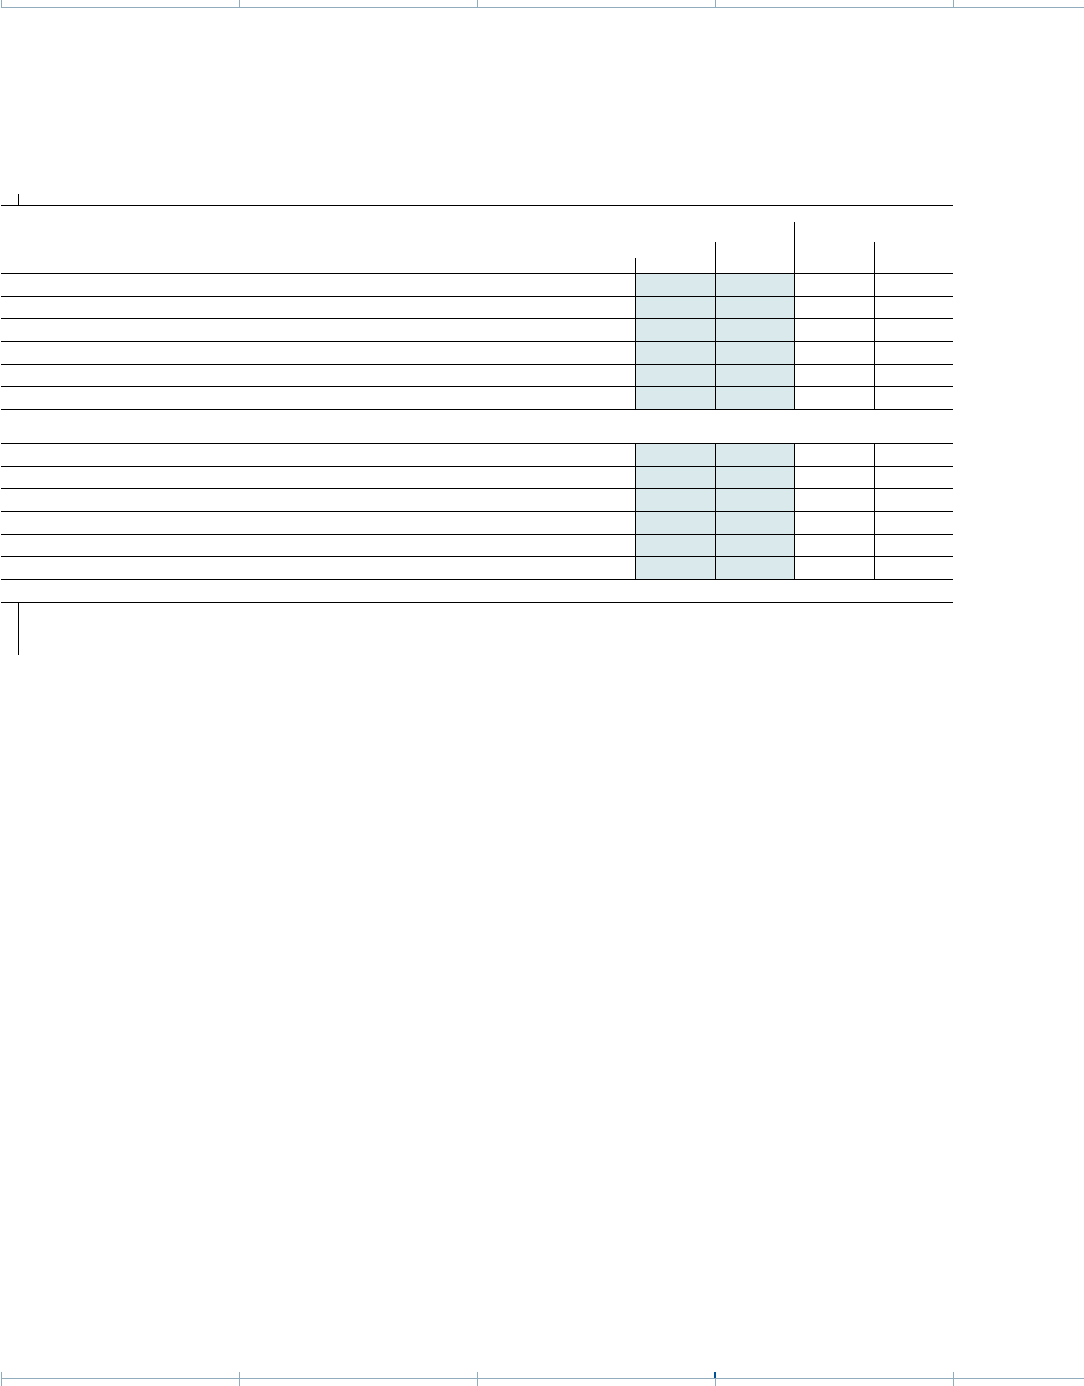
B27T082_E
September 30, 2009 September 30, 2008
Fair Value Carrying
Amount
Fair Value Carrying
Amount
Financial assets measured at cost or amortized cost
Trade and other receivables 113,950 13,950 14,627 14,627
Receivables from finance leases 4,885 4,885 5,160 5,160
Cash and cash equivalents 10,159 10,159 6,893 6,893
Other non-derivative financial assets 5,284 5,284 5,351 5,351
Available-for-sale financial assets 2– 335 – 518
Financial liabilities measured at cost or amortized cost
Notes and bonds 16,373 16,502 12,069 12,966
Trade payables 7,617 7,617 8,886 8,886
Loans from banks and other financial indebtedness 2,941 2,942 2,820 2,879
Obligations under finance leases 191 194 228 233
Other non-derivative financial liabilities 1,284 1,284 1,373 1,373
This caption consists of (i) €, and €, short-term trade and other receivables (except for receivables from finance leases) in fiscal and fiscal , respectively (see Note ),
(ii) € and € trade receivables from sale of goods and services in fiscal and fiscal , respectively (see Note ) as well as (iii) € and € receivables from associated and
other companies (defined in Note ) in fiscal and fiscal , respectively, see Note .
This caption consists of equity instruments classified as available-for-sale, for which a fair value could not be reliably measured and which are recognized at cost.