Siemens 2011 Annual Report Download - page 160
Download and view the complete annual report
Please find page 160 of the 2011 Siemens annual report below. You can navigate through the pages in the report by either clicking on the pages listed below, or by using the keyword search tool below to find specific information within the annual report.-
 1
1 -
2
-
3
-
4
-
5
-
6
-
7
-
8
-
9
-
10
-
11
-
12
-
13
-
14
-
15
-
16
-
17
-
18
-
19
-
20
-
21
-
22
-
23
-
24
-
25
-
26
-
27
-
28
-
29
-
30
-
31
-
32
-
33
-
34
-
35
-
36
-
37
-
38
-
39
-
40
-
41
-
42
-
43
-
44
-
45
-
46
-
47
-
48
-
49
-
50
-
51
-
52
-
53
-
54
-
55
-
56
-
57
-
58
-
59
-
60
-
61
-
62
-
63
-
64
-
65
-
66
-
67
-
68
-
69
-
70
-
71
-
72
-
73
-
74
-
75
-
76
-
77
-
78
-
79
-
80
-
81
-
82
-
83
-
84
-
85
-
86
-
87
-
88
-
89
-
90
-
91
-
92
-
93
-
94
-
95
-
96
-
97
-
98
-
99
-
100
-
101
-
102
-
103
-
104
-
105
-
106
-
107
-
108
-
109
-
110
-
111
-
112
-
113
-
114
-
115
-
116
-
117
-
118
-
119
-
120
-
121
-
122
-
123
-
124
-
125
-
126
-
127
-
128
-
129
-
130
-
131
-
132
-
133
-
134
-
135
-
136
-
137
-
138
-
139
-
140
-
141
-
142
-
143
-
144
-
145
-
146
-
147
-
148
-
149
-
 150
150 -
 151
151 -
 152
152 -
 153
153 -
 154
154 -
 155
155 -
 156
156 -
 157
157 -
 158
158 -
 159
159 -
 160
160 -
 161
161 -
 162
162 -
 163
163 -
 164
164 -
 165
165 -
 166
166 -
 167
167 -
 168
168 -
 169
169 -
 170
170 -
171
-
172
-
173
-
174
-
175
-
176
-
177
-
178
-
179
-
180
-
181
-
182
-
183
-
184
-
185
-
186
-
187
-
188
-
189
-
190
-
191
-
192
-
193
-
194
-
195
-
196
-
197
-
198
-
199
-
200
-
201
-
202
-
203
-
204
-
205
-
206
-
207
-
208
-
209
-
210
-
211
-
212
-
213
-
214
-
215
-
216
-
217
-
218
-
219
-
220
-
221
-
222
-
223
-
224
-
225
-
226
-
227
-
228
-
229
-
230
-
231
-
232
-
233
-
234
-
235
-
236
-
237
-
238
-
239
-
240
-
241
-
242
-
243
-
244
-
245
-
246
-
247
-
248
-
249
-
250
-
251
-
252
-
253
-
254
-
255
-
256
-
257
-
258
-
259
-
260
-
261
-
262
-
263
-
264
-
265
-
266
-
267
-
268
-
269
-
270
-
271
-
272
-
273
-
274
-
275
-
276
-
277
-
278
-
279
-
280
-
281
-
282
-
283
-
284
-
285
-
286
-
287
-
288
-
289
-
290
-
291
-
292
-
293
-
294
-
295
-
296
-
297
-
298
-
299
-
300
-
301
-
302
-
303
-
304
-
305
-
306
-
307
-
308
-
309
-
310
-
311
-
312
-
313
-
314
-
315
-
316
-
317
-
318
-
319
-
320
-
321
-
322
-
323
-
324
-
325
-
326
-
327
-
328
-
329
-
330
-
331
-
332
-
333
-
334
-
335
-
336
-
337
-
338
-
339
-
340
-
341
-
342
-
343
-
344
-
345
-
346
-
347
-
348
-
349
-
350
-
351
-
352
-
353
-
354
-
355
-
356
-
357
-
358
-
359
-
360
-
361
-
362
-
363
-
364
-
365
-
366
-
367
-
368
-
369
-
370
-
371
-
372
-
373
-
374
-
375
-
376
-
377
-
378
-
379
-
380
-
381
-
382
-
383
-
384
-
385
-
386
-
387
-
388
 |
 |

6 A. To our shareholders
23 B. Corporate Governance 51 C. Combined management’s discussion and analysis
52 C. Business and operating environment
80 C.2 Fiscal – Financial summary
83 C. Results of operations
101 C. Financial position
114 C. Net assets position
117 C. Overall assessment of the economic position
118 C. Report on post-balance sheet date events
119 C. Report on expected developments and
associated material opportunities and risks
135 C. Information required pursuant to Section ()
and Section () of the German Commercial
Code (HGB) and explanatory report
resenting % to % of net income which for these purposes
we adjust to exclude selected exceptional non-cash effects.
We intend to fund the dividend payout from our generated
Free cash flow. The Managing Board has proposed a dividend
of €. per share of the fiscal earnings of Siemens AG,
representing a total payout of €. billion based on shares
outstanding as of September , . Payment of the pro-
posed dividend is contingent upon approval by Siemens
shareholders at the Annual Shareholders’ Meeting on January
, . Based on this proposal the dividend payout percent-
age would be % for fiscal based on net income of €.
billion. The percentage for fiscal was % based on a to-
tal dividend payout of €. billion and net income of €.
billion. The net income for fiscal was adjusted for excep-
tional non-cash-effects of €. billion related to impairment
charges at Diagnostics.
C... ADDITIONAL INDICATORS
In addition to the financial indicators discussed above, we use
several other metrics to assess the economic success of our
business activities. To determine whether a particular invest-
ment is likely to generate value for Siemens, we use net pres-
ent value or economic value added (EVA™). EVA™ considers
the cost of capital in calculating value creation by comparing
the expected earnings of an investment against the cost of
capital employed. EVA™ is also an indicator for measuring
capital efficiency in our Sectors and SFS.
To measure our liquidity management, we analyze the net
working capital turns of our operating activities, as well as the
capital expenditure rate, defined as the ratio of additions to
intangible assets and property, plant and equipment and addi-
tions to assets held for rental in operating leases to deprecia-
tion and impairments of property, plant and equipment, net
of reversals of impairments as well as amortization and im-
pairments of intangible assets, net of reversals of impair-
ments (as presented in D. Notes to Consolidated Financial
Statements). Goodwill impairment is excluded. For our capital
expenditure rate, we have set a target range of % to %.
For
further information, see C.. Capital resources and require-
ments. In addition, we set hurdle rates that generally need to
be considered before acquisitions are executed. In general, ac-
quisitions need to be accretive to EVA™ within two years after
the closing of the transaction and need to be in line with our
ROCE (adjusted) target within three years after the integration.
C.. Value chain
C... RESEARCH AND DEVELOPMENT
In fiscal , our research and development (R&D) activities
were targeted as before on: () ensuring long-term future via-
bility, () enhancing technological competitiveness, and ()
optimizing the allocation of R&D resources.
As in previous years, in fiscal intelligent innovation man-
agement helped Siemens develop key technologies and bring
important innovations to market maturity. Examples of suc-
cessful innovations from Siemens’ Environmental Portfolio in
fiscal include the latest generation of gas turbines as well
as High-Voltage Direct Current (HVDC) transmission technolo-
gy. The world‘s most high-powered gas turbine is currently
operating in Irsching, Bavaria. In combination with a steam
turbine, it reached an extraordinary efficiency level of .%
and an output of megawatts in May . Beginning in
, six of these turbines will be operating in Florida, where
Florida Power & Light is modernizing its power plants in order
to achieve net savings of almost US$ billion over the tur-
bines‘ lifecycle. HVDC technology can transport electricity
over thousands of kilometers with minimal losses – for exam-
ple in China, where a Siemens HVDC transmission line carry-
ing a world-record , volts connects hydroelectric pow-
er plants in Yunnan Province with metropolitan areas in the
Pearl River Delta. This technology is also ideally suited to con-
nect wind parks located far offshore with power grids on land
with a high degree of energy efficiency.
The overall focus of our R&D activities – for example, those in
our Environmental Portfolio – is on increasing the efficiency
of both renewable and conventional power generation, im-
proving low-loss power transmission, as well as on finding
new solutions for intelligent power networks (smart grids),
solar energy, carbon dioxide separation in power plants, and
energy storage systems for volatile renewable energies. Fur-
ther focus areas are the promotion of more efficient energy
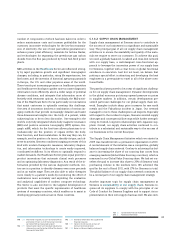
Dividend payout percentage
FY 41%
FY
46%
Target range: – %
1 Adjusted for exceptional non-cash effects of €. billion related to impairment
charges at Diagnostics in fiscal .
Total dividend payout
× 100%
Net income (adjusted)