Siemens 2011 Annual Report Download - page 214
Download and view the complete annual report
Please find page 214 of the 2011 Siemens annual report below. You can navigate through the pages in the report by either clicking on the pages listed below, or by using the keyword search tool below to find specific information within the annual report.-
 1
1 -
2
-
3
-
4
-
5
-
6
-
7
-
8
-
9
-
10
-
11
-
12
-
13
-
14
-
15
-
16
-
17
-
18
-
19
-
20
-
21
-
22
-
23
-
24
-
25
-
26
-
27
-
28
-
29
-
30
-
31
-
32
-
33
-
34
-
35
-
36
-
37
-
38
-
39
-
40
-
41
-
42
-
43
-
44
-
45
-
46
-
47
-
48
-
49
-
50
-
51
-
52
-
53
-
54
-
55
-
56
-
57
-
58
-
59
-
60
-
61
-
62
-
63
-
64
-
65
-
66
-
67
-
68
-
69
-
70
-
71
-
72
-
73
-
74
-
75
-
76
-
77
-
78
-
79
-
80
-
81
-
82
-
83
-
84
-
85
-
86
-
87
-
88
-
89
-
90
-
91
-
92
-
93
-
94
-
95
-
96
-
97
-
98
-
99
-
100
-
101
-
102
-
103
-
104
-
105
-
106
-
107
-
108
-
109
-
110
-
111
-
112
-
113
-
114
-
115
-
116
-
117
-
118
-
119
-
120
-
121
-
122
-
123
-
124
-
125
-
126
-
127
-
128
-
129
-
130
-
131
-
132
-
133
-
134
-
135
-
136
-
137
-
138
-
139
-
140
-
141
-
142
-
143
-
144
-
145
-
146
-
147
-
148
-
149
-
150
-
151
-
152
-
153
-
154
-
155
-
156
-
157
-
158
-
159
-
160
-
161
-
162
-
163
-
164
-
165
-
166
-
167
-
168
-
169
-
170
-
171
-
172
-
173
-
174
-
175
-
176
-
177
-
178
-
179
-
180
-
181
-
182
-
183
-
184
-
185
-
186
-
187
-
188
-
189
-
190
-
191
-
192
-
193
-
194
-
195
-
196
-
197
-
198
-
199
-
200
-
201
-
202
-
203
-
 204
204 -
 205
205 -
 206
206 -
 207
207 -
 208
208 -
 209
209 -
 210
210 -
 211
211 -
 212
212 -
 213
213 -
 214
214 -
 215
215 -
 216
216 -
 217
217 -
 218
218 -
 219
219 -
 220
220 -
 221
221 -
 222
222 -
 223
223 -
 224
224 -
225
-
226
-
227
-
228
-
229
-
230
-
231
-
232
-
233
-
234
-
235
-
236
-
237
-
238
-
239
-
240
-
241
-
242
-
243
-
244
-
245
-
246
-
247
-
248
-
249
-
250
-
251
-
252
-
253
-
254
-
255
-
256
-
257
-
258
-
259
-
260
-
261
-
262
-
263
-
264
-
265
-
266
-
267
-
268
-
269
-
270
-
271
-
272
-
273
-
274
-
275
-
276
-
277
-
278
-
279
-
280
-
281
-
282
-
283
-
284
-
285
-
286
-
287
-
288
-
289
-
290
-
291
-
292
-
293
-
294
-
295
-
296
-
297
-
298
-
299
-
300
-
301
-
302
-
303
-
304
-
305
-
306
-
307
-
308
-
309
-
310
-
311
-
312
-
313
-
314
-
315
-
316
-
317
-
318
-
319
-
320
-
321
-
322
-
323
-
324
-
325
-
326
-
327
-
328
-
329
-
330
-
331
-
332
-
333
-
334
-
335
-
336
-
337
-
338
-
339
-
340
-
341
-
342
-
343
-
344
-
345
-
346
-
347
-
348
-
349
-
350
-
351
-
352
-
353
-
354
-
355
-
356
-
357
-
358
-
359
-
360
-
361
-
362
-
363
-
364
-
365
-
366
-
367
-
368
-
369
-
370
-
371
-
372
-
373
-
374
-
375
-
376
-
377
-
378
-
379
-
380
-
381
-
382
-
383
-
384
-
385
-
386
-
387
-
388
 |
 |

6 A. To our shareholders
23 B. Corporate Governance 51 C. Combined management’s discussion and analysis
52 C. Business and operating environment
80 C. Fiscal – Financial summary
83 C. Results of operations
101 C. Financial position
114 C. Net assets position
117 C. Overall assessment of the economic position
118 C. Report on post-balance sheet date events
119 C. Report on expected developments and
associated material opportunities and risks
135 C. Information required pursuant to Section ()
and Section () of the German Commercial
Code (HGB) and explanatory report
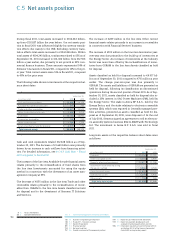
During fiscal , total assets increased to €. billion,
up from €. billion the year before. Our net assets posi-
tion in fiscal was influenced slightly by currency transla-
tion effects due mainly to the US$. Excluding currency trans-
lation effects total assets increased to €. billion. Within
total assets of €. billion, total assets related to SFS as of
September , increased to €. billion from €.
billion a year earlier, due primarily to net growth in SFS’ com-
mercial finance business. These amounts represented % of
Siemens’ total assets in fiscal , compared to % in the pri-
or year. Total current assets were % in fiscal , compared
to % in the prior year.
The following table shows current assets at the respective bal-
ance sheet dates:
(in millions of €)
September ,
Cash and cash equivalents 12,468 14,108
Available-for-sale financial assets 477 246
Trade and other receivables 14,847 15,502
Other current financial assets 2,899 2,610
Inventories 15,143 14,950
Income tax receivables 798 790
Other current assets 1,264 1,258
Assets classified as held for disposal 4,917 715
Total current assets 52,813 50,179
Cash and cash equivalents totaled €. billion as of Sep-
tember , . The decrease of €. billion was primarily
driven by an increase in cash outflows from financing activi-
ties. For detailed information, see C.. Cash flow – Fiscal
compared to fiscal .
The increase of the line item Available-for-sale financial assets
relates primarily to the reclassification of fund shares from
the line item Investments accounted for using the equity
method in connection with the divestment of an asset man-
agement company at SFS.
The decrease of € million in the line item Trade and other
receivables relates primarily to the reclassification of receiv-
ables from OSRAM to the line item Assets classified as held
for disposal and to the divestment of Siemens IT Solutions
and Services.
The increase of € million in the line item Other current
financial assets relates primarily to an increase in receivables
in connection with Financial Services’ business.
The increase of € million in the line item Inventories year-
over-year was due primarily to the build-up of inventories at
the Energy Sector. An increase of inventories at the Industry
Sector was more than offset by the reclassifications of inven-
tories from OSRAM to the line item Assets classified as held
for disposal.
Assets classified as held for disposal increased to €. bil-
lion as of September , compared to € million a year
earlier. The change year-over-year was due primarily to
OSRAM. The assets and liabilities of OSRAM are presented as
held for disposal, following its classification as discontinued
operations during the second quarter of fiscal . As of Sep-
tember , , assets classified as held for disposal also in-
cluded a % interest in OAO Power Machines (PM), held by
the Energy Sector. The stake in Areva NP S.A.S., held by the
Energy Sector, and the stake relating to electronics assembly
systems (EA), which was reported in Centrally managed port-
folio activities, presented as assets classified as held for dis-
posal as of September , , were disposed of. At the end
of July , Siemens signed an agreement to sell its electron-
ics assembly systems business (EA) to ASM Pacific Technology
Ltd. The investment in Areva N.P. S.A.S. was sold in fiscal
.
Long-term assets at the respective balance sheet dates were
as follows:
(in millions of €)
September ,
Goodwill 15,706 15,763
Other intangible assets 4,444 4,969
Property, plant and equipment 10,477 11,748
Investments accounted for using
the equity method 4,966 4,724
Other financial assets 11,855 10,765
Deferred tax assets 3,206 3,940
Other assets 776 739
Total long-term assets 51,430 52,648
C. Net assets position