Siemens 2011 Annual Report Download - page 289
Download and view the complete annual report
Please find page 289 of the 2011 Siemens annual report below. You can navigate through the pages in the report by either clicking on the pages listed below, or by using the keyword search tool below to find specific information within the annual report.-
 1
1 -
2
-
3
-
4
-
5
-
6
-
7
-
8
-
9
-
10
-
11
-
12
-
13
-
14
-
15
-
16
-
17
-
18
-
19
-
20
-
21
-
22
-
23
-
24
-
25
-
26
-
27
-
28
-
29
-
30
-
31
-
32
-
33
-
34
-
35
-
36
-
37
-
38
-
39
-
40
-
41
-
42
-
43
-
44
-
45
-
46
-
47
-
48
-
49
-
50
-
51
-
52
-
53
-
54
-
55
-
56
-
57
-
58
-
59
-
60
-
61
-
62
-
63
-
64
-
65
-
66
-
67
-
68
-
69
-
70
-
71
-
72
-
73
-
74
-
75
-
76
-
77
-
78
-
79
-
80
-
81
-
82
-
83
-
84
-
85
-
86
-
87
-
88
-
89
-
90
-
91
-
92
-
93
-
94
-
95
-
96
-
97
-
98
-
99
-
100
-
101
-
102
-
103
-
104
-
105
-
106
-
107
-
108
-
109
-
110
-
111
-
112
-
113
-
114
-
115
-
116
-
117
-
118
-
119
-
120
-
121
-
122
-
123
-
124
-
125
-
126
-
127
-
128
-
129
-
130
-
131
-
132
-
133
-
134
-
135
-
136
-
137
-
138
-
139
-
140
-
141
-
142
-
143
-
144
-
145
-
146
-
147
-
148
-
149
-
150
-
151
-
152
-
153
-
154
-
155
-
156
-
157
-
158
-
159
-
160
-
161
-
162
-
163
-
164
-
165
-
166
-
167
-
168
-
169
-
170
-
171
-
172
-
173
-
174
-
175
-
176
-
177
-
178
-
179
-
180
-
181
-
182
-
183
-
184
-
185
-
186
-
187
-
188
-
189
-
190
-
191
-
192
-
193
-
194
-
195
-
196
-
197
-
198
-
199
-
200
-
201
-
202
-
203
-
204
-
205
-
206
-
207
-
208
-
209
-
210
-
211
-
212
-
213
-
214
-
215
-
216
-
217
-
218
-
219
-
220
-
221
-
222
-
223
-
224
-
225
-
226
-
227
-
228
-
229
-
230
-
231
-
232
-
233
-
234
-
235
-
236
-
237
-
238
-
239
-
240
-
241
-
242
-
243
-
244
-
245
-
246
-
247
-
248
-
249
-
250
-
251
-
252
-
253
-
254
-
255
-
256
-
257
-
258
-
259
-
260
-
261
-
262
-
263
-
264
-
265
-
266
-
267
-
268
-
269
-
270
-
271
-
272
-
273
-
274
-
275
-
276
-
277
-
278
-
 279
279 -
 280
280 -
 281
281 -
 282
282 -
 283
283 -
 284
284 -
 285
285 -
 286
286 -
 287
287 -
 288
288 -
 289
289 -
 290
290 -
 291
291 -
 292
292 -
 293
293 -
 294
294 -
 295
295 -
 296
296 -
 297
297 -
 298
298 -
 299
299 -
300
-
301
-
302
-
303
-
304
-
305
-
306
-
307
-
308
-
309
-
310
-
311
-
312
-
313
-
314
-
315
-
316
-
317
-
318
-
319
-
320
-
321
-
322
-
323
-
324
-
325
-
326
-
327
-
328
-
329
-
330
-
331
-
332
-
333
-
334
-
335
-
336
-
337
-
338
-
339
-
340
-
341
-
342
-
343
-
344
-
345
-
346
-
347
-
348
-
349
-
350
-
351
-
352
-
353
-
354
-
355
-
356
-
357
-
358
-
359
-
360
-
361
-
362
-
363
-
364
-
365
-
366
-
367
-
368
-
369
-
370
-
371
-
372
-
373
-
374
-
375
-
376
-
377
-
378
-
379
-
380
-
381
-
382
-
383
-
384
-
385
-
386
-
387
-
388
 |
 |

153 D. Consolidated Financial Statements 273 E. Additional information
158 D. Consolidated Statements of Changes in Equity
160 D. Notes to Consolidated Financial Statements
266 D. Supervisory Board and Managing Board
154 D. Consolidated Statements of Income
155 D. Consolidated Statements of Comprehensive Income
156 D. Consolidated Statements of Financial Position
157 D. Consolidated Statements of Cash Flow
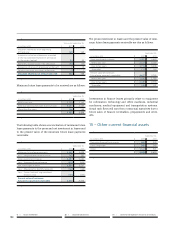
– Inventories
September ,
(in millions of €)
Raw materials and supplies 2,650 2,420
Work in process 3,711 3,724
Costs and earnings in excess of billings
on uncompleted contracts 7,849 7,538
Finished goods and products held for resale 2,317 2,866
Advances to suppliers 831 657
17,358 17,205
Advance payments received (2,215) (2,255)
15,143 14,950
Cost of goods sold and services rendered include inventories
recognized as an expense amounting to €, million and
€, million, respectively, in fiscal and . Raw ma-
terials and supplies, work in process as well as finished goods
and products held for resale are valued at the lower of acquisi-
tion / production cost and net realizable value. The respective
write-downs, as compared to prior year, increased (decreased)
by €() million and € million as of September ,
and .
Item Costs and earnings in excess of billings on uncompleted
contracts relates to construction contracts, with net asset bal-
ances where contract costs plus recognized profits less recog-
nized losses exceed progress billings. Construction contracts,
here and as follows, include service contracts accounted for
under the percentage of completion method. Liabilities from
contracts for which progress billings exceed costs and recog-
nized profits less recognized losses are recognized in line item
Other current liabilities; see
Note
Other current liabilities.
The aggregate amount of costs incurred and recognized prof-
its less recognized losses for construction contracts in prog-
ress, as of September , and amounted to €,
million and €, million, respectively. Revenue from con-
struction contracts amounted to €, million and €,
million, respectively, for fiscal and .
Advance payments received on construction contracts in
progress were €, million and €, million as of Sep-
tember , and . Retentions in connection with con-
struction contracts were € million and € million in fis-
cal and .
– Other current assets
September ,
(in millions of €)
Miscellaneous tax receivables 732 686
Prepaid expenses 250 296
Other 282 276
1,264 1,258
– Goodwill
Goodwill changed as follows:
Year ended September ,
(in millions of €)
Cost
Balance at beginning of year 17,436 16,317
Translation differences and other 104 898
Acquisitions and purchase
accounting adjustments 209 246
Dispositions and reclassifications
to assets classified as held for disposal (497) (25)
Balance at year-end 17,252 17,436
Accumulated impairment losses
and other changes
Balance at beginning of year 1,673 496
Translation differences and other (26) 32
Impairment losses recognized
during the period 264 1,145
Dispositions and reclassifications
to assets classified as held for disposal (365) –
Balance at year-end 1,546 1,673
Net book value
Balance at beginning of year 15,763 15,821
Balance at year-end 15,706 15,763