Siemens 2011 Annual Report Download - page 293
Download and view the complete annual report
Please find page 293 of the 2011 Siemens annual report below. You can navigate through the pages in the report by either clicking on the pages listed below, or by using the keyword search tool below to find specific information within the annual report.-
 1
1 -
2
-
3
-
4
-
5
-
6
-
7
-
8
-
9
-
10
-
11
-
12
-
13
-
14
-
15
-
16
-
17
-
18
-
19
-
20
-
21
-
22
-
23
-
24
-
25
-
26
-
27
-
28
-
29
-
30
-
31
-
32
-
33
-
34
-
35
-
36
-
37
-
38
-
39
-
40
-
41
-
42
-
43
-
44
-
45
-
46
-
47
-
48
-
49
-
50
-
51
-
52
-
53
-
54
-
55
-
56
-
57
-
58
-
59
-
60
-
61
-
62
-
63
-
64
-
65
-
66
-
67
-
68
-
69
-
70
-
71
-
72
-
73
-
74
-
75
-
76
-
77
-
78
-
79
-
80
-
81
-
82
-
83
-
84
-
85
-
86
-
87
-
88
-
89
-
90
-
91
-
92
-
93
-
94
-
95
-
96
-
97
-
98
-
99
-
100
-
101
-
102
-
103
-
104
-
105
-
106
-
107
-
108
-
109
-
110
-
111
-
112
-
113
-
114
-
115
-
116
-
117
-
118
-
119
-
120
-
121
-
122
-
123
-
124
-
125
-
126
-
127
-
128
-
129
-
130
-
131
-
132
-
133
-
134
-
135
-
136
-
137
-
138
-
139
-
140
-
141
-
142
-
143
-
144
-
145
-
146
-
147
-
148
-
149
-
150
-
151
-
152
-
153
-
154
-
155
-
156
-
157
-
158
-
159
-
160
-
161
-
162
-
163
-
164
-
165
-
166
-
167
-
168
-
169
-
170
-
171
-
172
-
173
-
174
-
175
-
176
-
177
-
178
-
179
-
180
-
181
-
182
-
183
-
184
-
185
-
186
-
187
-
188
-
189
-
190
-
191
-
192
-
193
-
194
-
195
-
196
-
197
-
198
-
199
-
200
-
201
-
202
-
203
-
204
-
205
-
206
-
207
-
208
-
209
-
210
-
211
-
212
-
213
-
214
-
215
-
216
-
217
-
218
-
219
-
220
-
221
-
222
-
223
-
224
-
225
-
226
-
227
-
228
-
229
-
230
-
231
-
232
-
233
-
234
-
235
-
236
-
237
-
238
-
239
-
240
-
241
-
242
-
243
-
244
-
245
-
246
-
247
-
248
-
249
-
250
-
251
-
252
-
253
-
254
-
255
-
256
-
257
-
258
-
259
-
260
-
261
-
262
-
263
-
264
-
265
-
266
-
267
-
268
-
269
-
270
-
271
-
272
-
273
-
274
-
275
-
276
-
277
-
278
-
279
-
280
-
281
-
282
-
 283
283 -
 284
284 -
 285
285 -
 286
286 -
 287
287 -
 288
288 -
 289
289 -
 290
290 -
 291
291 -
 292
292 -
 293
293 -
 294
294 -
 295
295 -
 296
296 -
 297
297 -
 298
298 -
 299
299 -
 300
300 -
 301
301 -
 302
302 -
 303
303 -
304
-
305
-
306
-
307
-
308
-
309
-
310
-
311
-
312
-
313
-
314
-
315
-
316
-
317
-
318
-
319
-
320
-
321
-
322
-
323
-
324
-
325
-
326
-
327
-
328
-
329
-
330
-
331
-
332
-
333
-
334
-
335
-
336
-
337
-
338
-
339
-
340
-
341
-
342
-
343
-
344
-
345
-
346
-
347
-
348
-
349
-
350
-
351
-
352
-
353
-
354
-
355
-
356
-
357
-
358
-
359
-
360
-
361
-
362
-
363
-
364
-
365
-
366
-
367
-
368
-
369
-
370
-
371
-
372
-
373
-
374
-
375
-
376
-
377
-
378
-
379
-
380
-
381
-
382
-
383
-
384
-
385
-
386
-
387
-
388
 |
 |

153 D. Consolidated Financial Statements 273 E. Additional information
158 D. Consolidated Statements of Changes in Equity
160 D. Notes to Consolidated Financial Statements
266 D. Supervisory Board and Managing Board
154 D. Consolidated Statements of Income
155 D. Consolidated Statements of Comprehensive Income
156 D. Consolidated Statements of Financial Position
157 D. Consolidated Statements of Cash Flow
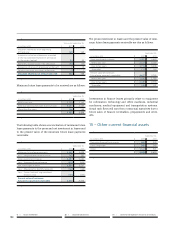
– Property, plant and equipment
Gross
carrying
amount
as of
//
Translation
differences
Additions
through
business
combina-
tions
Additions Reclassi-
fications
Retire-
ments
Gross
carrying
amount
as of
//
Accumu-
lated de-
preciation
and impair-
ment
Net
book
value
as of
//
Deprecia-
tion and
impair-
ment
in fiscal
(in millions of €)
Land and buildings 8,596 37 17 158 294 (992) 8,110 (3,850) 4,260 (261)
Technical machinery
and equipment 9,255 21 10 429 493 (3,619) 6,589 (4,223) 2,366 (460)
Furniture and office
equipment 6,797 (8) 26 725 113 (2,446) 5,207 (3,980) 1,227 (619)
Equipment leased to others 3,175 – 2 586 1 (463) 3,301 (1,614) 1,687 (359)
Advances to suppliers and
construction in progress 1,114 11 1 911 (901) (199) 9373–937 –
Property, plant
and equipment 28,937 61 56 2,809 – (7,719) 24,144 (13,667) 10,477 (1,699)
1 Includes Property, plant and equipment reclassified to Assets classified as held for disposal and dispositions of those entities, see Note 4 Acquisitions,
dispositions and discontinued operations.
2 Includes impairment expense of € million in fiscal , of which € million relate to Energy Sector, as well as € million related to SRE.
3 Includes € million expenditures for property, plant and equipment under construction.
As of September , and , contractual commitments
for purchases of property, plant and equipment amount to
€ million and € million, respectively.
In fiscal and , government grants awarded for the
purchase or the production of property, plant and equipment
amounted to € million and € million, respectively. The
award of further government grants of € million and €
million in fiscal and , respectively, related to costs in-
curred and future costs.
Gross
carrying
amount
as of
//
Translation
differences
Additions
through
business
combina-
tions
Additions Reclassi-
fications
Retire-
ments
Gross
carrying
amount
as of
//
Accumu-
lated de-
preciation
and impair-
ment
Net
book
value
as of
//
Deprecia-
tion and
impair-
ment
in fiscal
(in millions of €)
Land and buildings 8,663 289 31 241 286 (914) 8,596 (4,078) 4,518 (372)
Technical machinery
and equipment 8,639 327 54 369 278 (412) 9,255 (6,299) 2,956 (403)
Furniture and office
equipment 6,492 209 3 639 71 (617) 6,797 (5,294) 1,503 (637)
Equipment leased to others 2,677 154 – 623 9 (288) 3,175 (1,516) 1,659 (392)
Advances to suppliers and
construction in progress 963 37 10 764 (644) (16) 1,1143(2) 1,112 –
Property, plant
and equipment 27,434 1,016 98 2,636 – (2,247) 28,937 (17,189) 11,748 (1,804)
1 Includes Property, plant and equipment reclassified to Assets classified as held for disposal, see Note 4 Acquisitions, dispositions and discontinued operations.
2 Includes impairment expense of € million in fiscal , of which € million relate to impairment of real estate which were transferred from Healthcare's Diagnostics Division
to SRE, as well as € million related to SRE.
3 Includes € million expenditures for property, plant and equipment under construction.