Siemens 2011 Annual Report Download - page 206
Download and view the complete annual report
Please find page 206 of the 2011 Siemens annual report below. You can navigate through the pages in the report by either clicking on the pages listed below, or by using the keyword search tool below to find specific information within the annual report.-
 1
1 -
2
-
3
-
4
-
5
-
6
-
7
-
8
-
9
-
10
-
11
-
12
-
13
-
14
-
15
-
16
-
17
-
18
-
19
-
20
-
21
-
22
-
23
-
24
-
25
-
26
-
27
-
28
-
29
-
30
-
31
-
32
-
33
-
34
-
35
-
36
-
37
-
38
-
39
-
40
-
41
-
42
-
43
-
44
-
45
-
46
-
47
-
48
-
49
-
50
-
51
-
52
-
53
-
54
-
55
-
56
-
57
-
58
-
59
-
60
-
61
-
62
-
63
-
64
-
65
-
66
-
67
-
68
-
69
-
70
-
71
-
72
-
73
-
74
-
75
-
76
-
77
-
78
-
79
-
80
-
81
-
82
-
83
-
84
-
85
-
86
-
87
-
88
-
89
-
90
-
91
-
92
-
93
-
94
-
95
-
96
-
97
-
98
-
99
-
100
-
101
-
102
-
103
-
104
-
105
-
106
-
107
-
108
-
109
-
110
-
111
-
112
-
113
-
114
-
115
-
116
-
117
-
118
-
119
-
120
-
121
-
122
-
123
-
124
-
125
-
126
-
127
-
128
-
129
-
130
-
131
-
132
-
133
-
134
-
135
-
136
-
137
-
138
-
139
-
140
-
141
-
142
-
143
-
144
-
145
-
146
-
147
-
148
-
149
-
150
-
151
-
152
-
153
-
154
-
155
-
156
-
157
-
158
-
159
-
160
-
161
-
162
-
163
-
164
-
165
-
166
-
167
-
168
-
169
-
170
-
171
-
172
-
173
-
174
-
175
-
176
-
177
-
178
-
179
-
180
-
181
-
182
-
183
-
184
-
185
-
186
-
187
-
188
-
189
-
190
-
191
-
192
-
193
-
194
-
195
-
 196
196 -
 197
197 -
 198
198 -
 199
199 -
 200
200 -
 201
201 -
 202
202 -
 203
203 -
 204
204 -
 205
205 -
 206
206 -
 207
207 -
 208
208 -
 209
209 -
 210
210 -
 211
211 -
 212
212 -
 213
213 -
 214
214 -
 215
215 -
 216
216 -
217
-
218
-
219
-
220
-
221
-
222
-
223
-
224
-
225
-
226
-
227
-
228
-
229
-
230
-
231
-
232
-
233
-
234
-
235
-
236
-
237
-
238
-
239
-
240
-
241
-
242
-
243
-
244
-
245
-
246
-
247
-
248
-
249
-
250
-
251
-
252
-
253
-
254
-
255
-
256
-
257
-
258
-
259
-
260
-
261
-
262
-
263
-
264
-
265
-
266
-
267
-
268
-
269
-
270
-
271
-
272
-
273
-
274
-
275
-
276
-
277
-
278
-
279
-
280
-
281
-
282
-
283
-
284
-
285
-
286
-
287
-
288
-
289
-
290
-
291
-
292
-
293
-
294
-
295
-
296
-
297
-
298
-
299
-
300
-
301
-
302
-
303
-
304
-
305
-
306
-
307
-
308
-
309
-
310
-
311
-
312
-
313
-
314
-
315
-
316
-
317
-
318
-
319
-
320
-
321
-
322
-
323
-
324
-
325
-
326
-
327
-
328
-
329
-
330
-
331
-
332
-
333
-
334
-
335
-
336
-
337
-
338
-
339
-
340
-
341
-
342
-
343
-
344
-
345
-
346
-
347
-
348
-
349
-
350
-
351
-
352
-
353
-
354
-
355
-
356
-
357
-
358
-
359
-
360
-
361
-
362
-
363
-
364
-
365
-
366
-
367
-
368
-
369
-
370
-
371
-
372
-
373
-
374
-
375
-
376
-
377
-
378
-
379
-
380
-
381
-
382
-
383
-
384
-
385
-
386
-
387
-
388
 |
 |

6 A. To our shareholders
23 B. Corporate Governance 51 C. Combined management’s discussion and analysis
52 C. Business and operating environment
80 C. Fiscal – Financial summary
83 C. Results of operations
101 C. Financial position
114 C. Net assets position
117 C. Overall assessment of the economic position
118 C. Report on post-balance sheet date events
119 C. Report on expected developments and
associated material opportunities and risks
135 C. Information required pursuant to Section ()
and Section () of the German Commercial
Code (HGB) and explanatory report
that matured in July , and a payment of €. billion relat-
ed to the binding offer to purchase additional shares in order
to increase our stake in our publicly listed Indian subsidiary
Siemens Ltd. from about % to a maximum of %. In addi-
tion dividends paid to shareholders (for fiscal ) in the cur-
rent period were €. billion, up from €. billion paid
(for fiscal ) in fiscal . These cash outflows were part-
ly offset by cash inflows from changes in short-term debt and
other financing activities of € million, due mainly to cash
inflows related to the settlement of financial derivatives used
to hedge currency exposure in our financing activities. For
comparison cash outflows from changes in short-term debt
and other financing activities of € million in the prior year
included higher repayments of commercial paper and pay-
ments related to the settlement of financial derivatives used
to hedge currency exposure in our financing activities.
In fiscal we recorded cash outflows of €. billion for fi-
nancing of discontinued operations, compared to cash out-
flows of € million a year earlier. Discontinued operations
are financed principally from Corporate Treasury. The item Fi-
nancing discontinued operations includes these intercompa-
ny financing transactions.
C.. Capital resources
and requirements
Siemens’ capital resources consist of a variety of short- and
long-term financial instruments including, but not limited to,
loans from financial institutions, commercial paper, medium-
term notes and bonds. In addition to cash and cash equiva-
lents and to available-for-sale financial assets liquid resources
consist of future cash flows from operating activities.
Our capital requirements include, among others, scheduled
debt service, regular capital spending, ongoing cash require-
ments from operating and SFS financing activities, including
higher cash outflows related to the announced growth strate-
gy of SFS, dividend payments, pension plan funding, portfolio
activities, and cash outflows in connection with restructuring
measures.
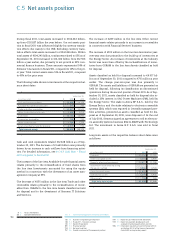
Total debt comprises our Notes and bonds, Loans from banks,
Obligations under finance leases and Other financial indebt-
edness such as commercial paper. Total debt comprises Short-
term debt and current maturities of long-term debt as well as
Long-term debt, as stated on the Consolidated Statements of
Financial Position. Total liquidity refers to the liquid financial
assets we had available at the respective balance sheet dates
to fund our business operations and pay for near-term obliga-
tions. Total liquidity comprises Cash and cash equivalents as
well as current Available-for-sale financial assets, as stated on
the Consolidated Statements of Financial Position. Net debt
results from total debt less total liquidity. Management uses
the Net debt measure for internal corporate finance manage-
ment, as well as for external communication with investors,
analysts and rating agencies, and accordingly we believe that
presentation of Net debt is useful for those concerned. Net
debt should not, however, be considered in isolation or as an
alternative to short-term debt and long-term debt as present-
ed in accordance with IFRS. For further information about the
usefulness and limitations of Net debt, see C. Notes and
forward-looking statements.
(in millions of €)
September ,
Short-term debt and current maturities
of long-term debt 3,660 2,416
Long-term debt 14,280 17,497
Total debt 17,940 19,913
Cash and cash equivalents (12,468) (14,108)
Available-for-sale financial assets (current) (477) (246)
Total liquidity (12,945) (14,354)
Net debt 4,995 5,560
1 We typically need a considerable portion of our cash and cash equivalents as well
as current available-for-sale financial assets at any given time for purposes other
than debt reduction. The deduction of these items from total debt in the calcula-
tion of Net debt therefore should not be understood to mean that these items are
available exclusively for debt reduction at any given time. Net debt comprises items
as stated on the Consolidated Statements of Financial Position.