Siemens 2011 Annual Report Download - page 203
Download and view the complete annual report
Please find page 203 of the 2011 Siemens annual report below. You can navigate through the pages in the report by either clicking on the pages listed below, or by using the keyword search tool below to find specific information within the annual report.-
 1
1 -
2
-
3
-
4
-
5
-
6
-
7
-
8
-
9
-
10
-
11
-
12
-
13
-
14
-
15
-
16
-
17
-
18
-
19
-
20
-
21
-
22
-
23
-
24
-
25
-
26
-
27
-
28
-
29
-
30
-
31
-
32
-
33
-
34
-
35
-
36
-
37
-
38
-
39
-
40
-
41
-
42
-
43
-
44
-
45
-
46
-
47
-
48
-
49
-
50
-
51
-
52
-
53
-
54
-
55
-
56
-
57
-
58
-
59
-
60
-
61
-
62
-
63
-
64
-
65
-
66
-
67
-
68
-
69
-
70
-
71
-
72
-
73
-
74
-
75
-
76
-
77
-
78
-
79
-
80
-
81
-
82
-
83
-
84
-
85
-
86
-
87
-
88
-
89
-
90
-
91
-
92
-
93
-
94
-
95
-
96
-
97
-
98
-
99
-
100
-
101
-
102
-
103
-
104
-
105
-
106
-
107
-
108
-
109
-
110
-
111
-
112
-
113
-
114
-
115
-
116
-
117
-
118
-
119
-
120
-
121
-
122
-
123
-
124
-
125
-
126
-
127
-
128
-
129
-
130
-
131
-
132
-
133
-
134
-
135
-
136
-
137
-
138
-
139
-
140
-
141
-
142
-
143
-
144
-
145
-
146
-
147
-
148
-
149
-
150
-
151
-
152
-
153
-
154
-
155
-
156
-
157
-
158
-
159
-
160
-
161
-
162
-
163
-
164
-
165
-
166
-
167
-
168
-
169
-
170
-
171
-
172
-
173
-
174
-
175
-
176
-
177
-
178
-
179
-
180
-
181
-
182
-
183
-
184
-
185
-
186
-
187
-
188
-
189
-
190
-
191
-
192
-
 193
193 -
 194
194 -
 195
195 -
 196
196 -
 197
197 -
 198
198 -
 199
199 -
 200
200 -
 201
201 -
 202
202 -
 203
203 -
 204
204 -
 205
205 -
 206
206 -
 207
207 -
 208
208 -
 209
209 -
 210
210 -
 211
211 -
 212
212 -
 213
213 -
214
-
215
-
216
-
217
-
218
-
219
-
220
-
221
-
222
-
223
-
224
-
225
-
226
-
227
-
228
-
229
-
230
-
231
-
232
-
233
-
234
-
235
-
236
-
237
-
238
-
239
-
240
-
241
-
242
-
243
-
244
-
245
-
246
-
247
-
248
-
249
-
250
-
251
-
252
-
253
-
254
-
255
-
256
-
257
-
258
-
259
-
260
-
261
-
262
-
263
-
264
-
265
-
266
-
267
-
268
-
269
-
270
-
271
-
272
-
273
-
274
-
275
-
276
-
277
-
278
-
279
-
280
-
281
-
282
-
283
-
284
-
285
-
286
-
287
-
288
-
289
-
290
-
291
-
292
-
293
-
294
-
295
-
296
-
297
-
298
-
299
-
300
-
301
-
302
-
303
-
304
-
305
-
306
-
307
-
308
-
309
-
310
-
311
-
312
-
313
-
314
-
315
-
316
-
317
-
318
-
319
-
320
-
321
-
322
-
323
-
324
-
325
-
326
-
327
-
328
-
329
-
330
-
331
-
332
-
333
-
334
-
335
-
336
-
337
-
338
-
339
-
340
-
341
-
342
-
343
-
344
-
345
-
346
-
347
-
348
-
349
-
350
-
351
-
352
-
353
-
354
-
355
-
356
-
357
-
358
-
359
-
360
-
361
-
362
-
363
-
364
-
365
-
366
-
367
-
368
-
369
-
370
-
371
-
372
-
373
-
374
-
375
-
376
-
377
-
378
-
379
-
380
-
381
-
382
-
383
-
384
-
385
-
386
-
387
-
388
 |
 |

153 D. Consolidated Financial Statements
273 E. Additional information
143 C. Additional information for supplemental
financial measures
145 C. Siemens AG (Discussion on basis of
German Commercial Code)
151 C. Notes and forward-looking statements
140 C. Information required pursuant to Section ()
and Section () no. of the German Commer-
cial Code (HGB) and explanatory report
142 C. Compensation report and Corporate Governance
statement pursuant to Section a of the German
Commercial Code (HGB)
increase in total equity as a percentage of total capital to %
compared to % in fiscal . Accordingly, total debt as a
percentage of total capital decreased to % from % in the
prior year. For more detailed information on changes in equity
and in debt, see C. Net assets position and D. Notes to
Consolidated Financial Statements.
We have commitments to sell or otherwise issue common
shares in connection with established share-based compensa-
tion plans. In fiscal , commitments for share-based com-
pensation were fulfilled through treasury shares. In fiscal
, we may again fulfill commitments for share-based com-
pensation through treasury shares. For additional information
with respect to share-based compensation and treasury
shares, see D. Notes to Consolidated Financial Statements.
As part of our One Siemens framework for sustainable value
creation, Siemens decided to continue to use an indicator to
optimize its capital structure. For further information see
C.. Financial performance measures. A key consideration
in this regard is maintenance of ready access to the capital
markets through various debt products and preservation of
our ability to repay and service our debt obligations over time.
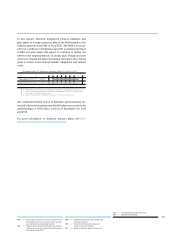
Siemens set a capital structure target range of . – .. The
ratio is defined as the item Adjusted industrial net debt divid-
ed by the item Adjusted EBITDA (continuing operations). The
calculation of the item Adjusted industrial net debt is set forth
in the table below. Adjusted EBITDA (continuing operations)
is defined as adjusted earnings before income taxes (EBIT) be-
fore amortization (defined as amortization and impairments,
net of reversals, of intangible assets other than goodwill) and
depreciation and impairments of property, plant and equip-
ment and goodwill. Adjusted EBIT is defined as the line item
Income from continuing operations before income taxes less
the line item Interest income, less the line item Interest ex-
pense less the line item Other financial income (expense), net
as well as less the line item Income (loss) from investments
accounted for using the equity method, net. For further infor-
mation see C.. Reconciliation to adjusted EBITDA (con-
tinuing operations).
(in millions of €)
September ,
Short term debt and current maturities of long-term debt 3,660 2,416
Plus: Long term debt 14,280 17,497
Less: Cash and cash equivalents (12,468) (14,108)
Less: Current available-for-sale financial assets (477) (246)
Net debt 4,995 5,560
Less: SFS Debt (12,075) (10,028)
Plus: Pension plans and similar commitments 7,307 8,464
Plus: Credit guarantees 591 597
Less: % nominal amount hybrid bond (883) (886)
Less: Fair value hedge accounting adjustment (1,470) (1,518)
Adjusted industrial net debt (1,534) 2,189
Adjusted EBITDA (continuing operations) 10,596 9,805
Adjusted industrial net debt / adjusted EBITDA (continuing operations) (0.14) 0.22
1 The item Short-term debt and current maturities of long-term debt as well as the item Long-term debt included in total fair value hedge accounting adjustments of €, million
and €, million for the fiscal year ended September , and , respectively.
2 In fiscal , to consider Siemens’ total pension liability, adjusted industrial net debt includes line item Pension plans and similar commitments as presented in the Consolidated
Statement of Financial Position. Prior-year amounts are reclassified to conform to the current-year presentation.
3 The adjustment for our hybrid bond considers the calculation of this financial ratio applied by rating agencies to classify % of our hybrid bond as equity and % as debt. This
assignment reflects the characteristics of our hybrid bond such as a long maturity date and subordination to all senior and debt obligations.
4 Debt is generally reported with a value representing approximately the amount to be repaid. However for debt designated in a hedging relationship (fair value hedges), this amount
is adjusted by changes in market value mainly due to changes in interest rates. Accordingly we deduct these changes in market value in order to end up with an amount of debt
that approximately will be repaid. We believe, this is a more meaningful figure for the calculation presented above. For further information on fair value hedges see D. Notes to
Consolidated Financial Statements.
Due to rounding, numbers presented may not add up precisely to totals provided.