Siemens 2011 Annual Report Download - page 292
Download and view the complete annual report
Please find page 292 of the 2011 Siemens annual report below. You can navigate through the pages in the report by either clicking on the pages listed below, or by using the keyword search tool below to find specific information within the annual report.-
 1
1 -
2
-
3
-
4
-
5
-
6
-
7
-
8
-
9
-
10
-
11
-
12
-
13
-
14
-
15
-
16
-
17
-
18
-
19
-
20
-
21
-
22
-
23
-
24
-
25
-
26
-
27
-
28
-
29
-
30
-
31
-
32
-
33
-
34
-
35
-
36
-
37
-
38
-
39
-
40
-
41
-
42
-
43
-
44
-
45
-
46
-
47
-
48
-
49
-
50
-
51
-
52
-
53
-
54
-
55
-
56
-
57
-
58
-
59
-
60
-
61
-
62
-
63
-
64
-
65
-
66
-
67
-
68
-
69
-
70
-
71
-
72
-
73
-
74
-
75
-
76
-
77
-
78
-
79
-
80
-
81
-
82
-
83
-
84
-
85
-
86
-
87
-
88
-
89
-
90
-
91
-
92
-
93
-
94
-
95
-
96
-
97
-
98
-
99
-
100
-
101
-
102
-
103
-
104
-
105
-
106
-
107
-
108
-
109
-
110
-
111
-
112
-
113
-
114
-
115
-
116
-
117
-
118
-
119
-
120
-
121
-
122
-
123
-
124
-
125
-
126
-
127
-
128
-
129
-
130
-
131
-
132
-
133
-
134
-
135
-
136
-
137
-
138
-
139
-
140
-
141
-
142
-
143
-
144
-
145
-
146
-
147
-
148
-
149
-
150
-
151
-
152
-
153
-
154
-
155
-
156
-
157
-
158
-
159
-
160
-
161
-
162
-
163
-
164
-
165
-
166
-
167
-
168
-
169
-
170
-
171
-
172
-
173
-
174
-
175
-
176
-
177
-
178
-
179
-
180
-
181
-
182
-
183
-
184
-
185
-
186
-
187
-
188
-
189
-
190
-
191
-
192
-
193
-
194
-
195
-
196
-
197
-
198
-
199
-
200
-
201
-
202
-
203
-
204
-
205
-
206
-
207
-
208
-
209
-
210
-
211
-
212
-
213
-
214
-
215
-
216
-
217
-
218
-
219
-
220
-
221
-
222
-
223
-
224
-
225
-
226
-
227
-
228
-
229
-
230
-
231
-
232
-
233
-
234
-
235
-
236
-
237
-
238
-
239
-
240
-
241
-
242
-
243
-
244
-
245
-
246
-
247
-
248
-
249
-
250
-
251
-
252
-
253
-
254
-
255
-
256
-
257
-
258
-
259
-
260
-
261
-
262
-
263
-
264
-
265
-
266
-
267
-
268
-
269
-
270
-
271
-
272
-
273
-
274
-
275
-
276
-
277
-
278
-
279
-
280
-
281
-
 282
282 -
 283
283 -
 284
284 -
 285
285 -
 286
286 -
 287
287 -
 288
288 -
 289
289 -
 290
290 -
 291
291 -
 292
292 -
 293
293 -
 294
294 -
 295
295 -
 296
296 -
 297
297 -
 298
298 -
 299
299 -
 300
300 -
 301
301 -
 302
302 -
303
-
304
-
305
-
306
-
307
-
308
-
309
-
310
-
311
-
312
-
313
-
314
-
315
-
316
-
317
-
318
-
319
-
320
-
321
-
322
-
323
-
324
-
325
-
326
-
327
-
328
-
329
-
330
-
331
-
332
-
333
-
334
-
335
-
336
-
337
-
338
-
339
-
340
-
341
-
342
-
343
-
344
-
345
-
346
-
347
-
348
-
349
-
350
-
351
-
352
-
353
-
354
-
355
-
356
-
357
-
358
-
359
-
360
-
361
-
362
-
363
-
364
-
365
-
366
-
367
-
368
-
369
-
370
-
371
-
372
-
373
-
374
-
375
-
376
-
377
-
378
-
379
-
380
-
381
-
382
-
383
-
384
-
385
-
386
-
387
-
388
 |
 |

6 A. To our shareholders 51 C. Combined management’s discussion and analysis 23 B. Corporate Governance
As a result of a strategic review, which was completed in the
three months ended September , , the Division’s medi-
um-term growth prospects and the long-term market develop-
ment in laboratory diagnostics have been reassessed and the
Division’s business planning has been adjusted accordingly to
reflect expected lower growth prospects. Cash flows beyond
the five-year planning period were extrapolated using a con-
stant growth rate of .%. The main reasons for these lower
growth prospects and therefore adjusted business targets are
delays in technology and product related development activi-
ties along with increasing competition. The adjusted business
plan resulting from the strategic review was the basis for the
annual goodwill impairment test in the three months ended
September , .
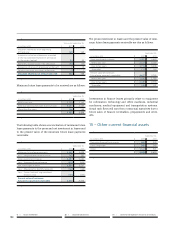
– Other intangible assets
Gross
carrying
amount
as of
//
Translation
differences
Additions
through
business
combina-
tions
Additions Retirements Gross
carrying
amount
as of
//
Accumulated
amortization
and
impairment
Net
book
value
as of
//
Amortization
and
impairment
in fiscal
(in millions of €)
Software and other internally
generated intangible assets 3,068 18 1 353 (485) 2,955 (1,775) 1,180 (246)
Patents, licenses
and similar rights 7,008 62 94 67 (566) 6,665 (3,401) 3,264 (565)
Other intangible assets 10,076 80 95 420 (1,051) 9,620 (5,176) 4,444 (811)
1 Includes Other intangible assets reclassified to Assets classified as held for disposal and dispositions of those entities, see Note 4 Acquisitions, dispositions and discontinued operations.
2 Includes impairment of € million in fiscal , thereof € million at the Energy Sector.
Gross
carrying
amount
as of
//
Translation
differences
Additions
through
business
combina-
tions
Additions Retirements Gross
carrying
amount
as of
//
Accumulated
amortization
and
impairment
Net
book
value
as of
//
Amortization
and
impairment
in fiscal
(in millions of €)
Software and other internally
generated intangible assets 2,664 106 – 395 (97) 3,068 (1,876) 1,192 (212)
Patents, licenses
and similar rights 6,519 338 87 117 (53) 7,008 (3,231) 3,777 (579)
Other intangible assets 9,183 444 87 512 (150) 10,076 (5,107) 4,969 (791)
1 Includes Other intangible assets reclassified to Assets classified as held for disposal, see Note 4 Acquisitions, dispositions and discontinued operations.
2 Includes impairment expense of € million in fiscal , thereof € million at the Healthcare Sector.
Amortization expense on intangible assets is included in line
items Cost of goods sold and services rendered, Research and
development expenses or Marketing, selling and general ad-
ministrative expenses, depending on the use of the asset.
As of September , and , contractual commitments
for purchases of other intangible assets amount to € million
and € million.