Siemens 2011 Annual Report Download - page 287
Download and view the complete annual report
Please find page 287 of the 2011 Siemens annual report below. You can navigate through the pages in the report by either clicking on the pages listed below, or by using the keyword search tool below to find specific information within the annual report.-
 1
1 -
2
-
3
-
4
-
5
-
6
-
7
-
8
-
9
-
10
-
11
-
12
-
13
-
14
-
15
-
16
-
17
-
18
-
19
-
20
-
21
-
22
-
23
-
24
-
25
-
26
-
27
-
28
-
29
-
30
-
31
-
32
-
33
-
34
-
35
-
36
-
37
-
38
-
39
-
40
-
41
-
42
-
43
-
44
-
45
-
46
-
47
-
48
-
49
-
50
-
51
-
52
-
53
-
54
-
55
-
56
-
57
-
58
-
59
-
60
-
61
-
62
-
63
-
64
-
65
-
66
-
67
-
68
-
69
-
70
-
71
-
72
-
73
-
74
-
75
-
76
-
77
-
78
-
79
-
80
-
81
-
82
-
83
-
84
-
85
-
86
-
87
-
88
-
89
-
90
-
91
-
92
-
93
-
94
-
95
-
96
-
97
-
98
-
99
-
100
-
101
-
102
-
103
-
104
-
105
-
106
-
107
-
108
-
109
-
110
-
111
-
112
-
113
-
114
-
115
-
116
-
117
-
118
-
119
-
120
-
121
-
122
-
123
-
124
-
125
-
126
-
127
-
128
-
129
-
130
-
131
-
132
-
133
-
134
-
135
-
136
-
137
-
138
-
139
-
140
-
141
-
142
-
143
-
144
-
145
-
146
-
147
-
148
-
149
-
150
-
151
-
152
-
153
-
154
-
155
-
156
-
157
-
158
-
159
-
160
-
161
-
162
-
163
-
164
-
165
-
166
-
167
-
168
-
169
-
170
-
171
-
172
-
173
-
174
-
175
-
176
-
177
-
178
-
179
-
180
-
181
-
182
-
183
-
184
-
185
-
186
-
187
-
188
-
189
-
190
-
191
-
192
-
193
-
194
-
195
-
196
-
197
-
198
-
199
-
200
-
201
-
202
-
203
-
204
-
205
-
206
-
207
-
208
-
209
-
210
-
211
-
212
-
213
-
214
-
215
-
216
-
217
-
218
-
219
-
220
-
221
-
222
-
223
-
224
-
225
-
226
-
227
-
228
-
229
-
230
-
231
-
232
-
233
-
234
-
235
-
236
-
237
-
238
-
239
-
240
-
241
-
242
-
243
-
244
-
245
-
246
-
247
-
248
-
249
-
250
-
251
-
252
-
253
-
254
-
255
-
256
-
257
-
258
-
259
-
260
-
261
-
262
-
263
-
264
-
265
-
266
-
267
-
268
-
269
-
270
-
271
-
272
-
273
-
274
-
275
-
276
-
 277
277 -
 278
278 -
 279
279 -
 280
280 -
 281
281 -
 282
282 -
 283
283 -
 284
284 -
 285
285 -
 286
286 -
 287
287 -
 288
288 -
 289
289 -
 290
290 -
 291
291 -
 292
292 -
 293
293 -
 294
294 -
 295
295 -
 296
296 -
 297
297 -
298
-
299
-
300
-
301
-
302
-
303
-
304
-
305
-
306
-
307
-
308
-
309
-
310
-
311
-
312
-
313
-
314
-
315
-
316
-
317
-
318
-
319
-
320
-
321
-
322
-
323
-
324
-
325
-
326
-
327
-
328
-
329
-
330
-
331
-
332
-
333
-
334
-
335
-
336
-
337
-
338
-
339
-
340
-
341
-
342
-
343
-
344
-
345
-
346
-
347
-
348
-
349
-
350
-
351
-
352
-
353
-
354
-
355
-
356
-
357
-
358
-
359
-
360
-
361
-
362
-
363
-
364
-
365
-
366
-
367
-
368
-
369
-
370
-
371
-
372
-
373
-
374
-
375
-
376
-
377
-
378
-
379
-
380
-
381
-
382
-
383
-
384
-
385
-
386
-
387
-
388
 |
 |

153 D. Consolidated Financial Statements 273 E. Additional information
158 D. Consolidated Statements of Changes in Equity
160 D. Notes to Consolidated Financial Statements
266 D. Supervisory Board and Managing Board
154 D. Consolidated Statements of Income
155 D. Consolidated Statements of Comprehensive Income
156 D. Consolidated Statements of Financial Position
157 D. Consolidated Statements of Cash Flow
Gross realized gains on sales of such available-for-sale finan-
cial assets were € million and €5 million, respectively, in fis-
cal and . Gross realized losses on sales of such avail-
able-for-sale financial assets were €– million and € million,
respectively, in fiscal and .
Non-current available-for-sale financial assets, which are in-
cluded in line item Other financial assets, see
Note
20 Other
financial assets are measured at fair value, if reliably measur-
able. They consist of equity instruments only. As of Septem-
ber , and non-current available-for-sale financial
assets at cost amounted to € million and € million, re-
spectively; non-current available-for-sale financial assets at
fair value amounted to € million and € million, respec-
tively, mainly consisting of shares in AtoS. Unrealized gains
(losses) in fiscal and resulting from non-current
available-for-sale financial assets at fair value were €() mil-
lion and € million, respectively.
Gross realized gains on sales of non-current available-for-sale
financial assets of continuing operations were € million
and € million, respectively, in fiscal and . Gross re-
alized losses on sales of non-current available-for-sale finan-
cial assets of continuing operations were € million and €
million, respectively, in fiscal and . Gross realized
gains mainly resulted from the sale of Areva, see
Note
9
Interest income, interest expense and other financial income
(expense), net.
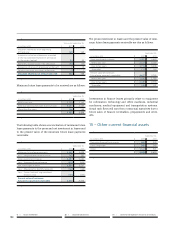
– Trade and other receivables
September ,
(in millions of €)
Trade receivables from the
sale of goods and services 13,088 13,717
Receivables from finance leases 1,759 1,785
14,847 15,502
Changes to the valuation allowance of current and long-term
receivables presented in Note , and , which belong to
the class of Financial assets and liabilities measured at (amor-
tized) cost are as follows (excluding receivables from finance
leases):
Year ended September ,
(in millions of €)
Valuation allowance as of beginning
of fiscal year 993 1,116
Increase in valuation allowances recorded
in the Consolidated Statements of Income
in the current period 210 70
Write-offs charged against the allowance (145) (240)
Recoveries of amounts previously written-off 13 13
Foreign exchange translation differences (10) 40
Reclassifications to line item Assets held for
disposal and dispositions of those entities (56) (6)
Valuation allowance as of fiscal year-end 1,005 993
Receivables from finance leases are presented in the State-
ments of Financial Position as follows:
September ,
(in millions of €)
Receivables from finance leases,
current 1,759 1,785
Receivables from finance leases,
long-term portion 2,983 3,094
4,742 4,879
The valuation allowance on current and long-term receivables
from finance leases changed as follows: see this
Note
and
Note
20 Other financial assets for further information on re-
ceivables from finance leases.