Siemens 2011 Annual Report Download - page 291
Download and view the complete annual report
Please find page 291 of the 2011 Siemens annual report below. You can navigate through the pages in the report by either clicking on the pages listed below, or by using the keyword search tool below to find specific information within the annual report.-
 1
1 -
2
-
3
-
4
-
5
-
6
-
7
-
8
-
9
-
10
-
11
-
12
-
13
-
14
-
15
-
16
-
17
-
18
-
19
-
20
-
21
-
22
-
23
-
24
-
25
-
26
-
27
-
28
-
29
-
30
-
31
-
32
-
33
-
34
-
35
-
36
-
37
-
38
-
39
-
40
-
41
-
42
-
43
-
44
-
45
-
46
-
47
-
48
-
49
-
50
-
51
-
52
-
53
-
54
-
55
-
56
-
57
-
58
-
59
-
60
-
61
-
62
-
63
-
64
-
65
-
66
-
67
-
68
-
69
-
70
-
71
-
72
-
73
-
74
-
75
-
76
-
77
-
78
-
79
-
80
-
81
-
82
-
83
-
84
-
85
-
86
-
87
-
88
-
89
-
90
-
91
-
92
-
93
-
94
-
95
-
96
-
97
-
98
-
99
-
100
-
101
-
102
-
103
-
104
-
105
-
106
-
107
-
108
-
109
-
110
-
111
-
112
-
113
-
114
-
115
-
116
-
117
-
118
-
119
-
120
-
121
-
122
-
123
-
124
-
125
-
126
-
127
-
128
-
129
-
130
-
131
-
132
-
133
-
134
-
135
-
136
-
137
-
138
-
139
-
140
-
141
-
142
-
143
-
144
-
145
-
146
-
147
-
148
-
149
-
150
-
151
-
152
-
153
-
154
-
155
-
156
-
157
-
158
-
159
-
160
-
161
-
162
-
163
-
164
-
165
-
166
-
167
-
168
-
169
-
170
-
171
-
172
-
173
-
174
-
175
-
176
-
177
-
178
-
179
-
180
-
181
-
182
-
183
-
184
-
185
-
186
-
187
-
188
-
189
-
190
-
191
-
192
-
193
-
194
-
195
-
196
-
197
-
198
-
199
-
200
-
201
-
202
-
203
-
204
-
205
-
206
-
207
-
208
-
209
-
210
-
211
-
212
-
213
-
214
-
215
-
216
-
217
-
218
-
219
-
220
-
221
-
222
-
223
-
224
-
225
-
226
-
227
-
228
-
229
-
230
-
231
-
232
-
233
-
234
-
235
-
236
-
237
-
238
-
239
-
240
-
241
-
242
-
243
-
244
-
245
-
246
-
247
-
248
-
249
-
250
-
251
-
252
-
253
-
254
-
255
-
256
-
257
-
258
-
259
-
260
-
261
-
262
-
263
-
264
-
265
-
266
-
267
-
268
-
269
-
270
-
271
-
272
-
273
-
274
-
275
-
276
-
277
-
278
-
279
-
280
-
 281
281 -
 282
282 -
 283
283 -
 284
284 -
 285
285 -
 286
286 -
 287
287 -
 288
288 -
 289
289 -
 290
290 -
 291
291 -
 292
292 -
 293
293 -
 294
294 -
 295
295 -
 296
296 -
 297
297 -
 298
298 -
 299
299 -
 300
300 -
 301
301 -
302
-
303
-
304
-
305
-
306
-
307
-
308
-
309
-
310
-
311
-
312
-
313
-
314
-
315
-
316
-
317
-
318
-
319
-
320
-
321
-
322
-
323
-
324
-
325
-
326
-
327
-
328
-
329
-
330
-
331
-
332
-
333
-
334
-
335
-
336
-
337
-
338
-
339
-
340
-
341
-
342
-
343
-
344
-
345
-
346
-
347
-
348
-
349
-
350
-
351
-
352
-
353
-
354
-
355
-
356
-
357
-
358
-
359
-
360
-
361
-
362
-
363
-
364
-
365
-
366
-
367
-
368
-
369
-
370
-
371
-
372
-
373
-
374
-
375
-
376
-
377
-
378
-
379
-
380
-
381
-
382
-
383
-
384
-
385
-
386
-
387
-
388
 |
 |

153 D. Consolidated Financial Statements 273 E. Additional information
158 D. Consolidated Statements of Changes in Equity
160 D. Notes to Consolidated Financial Statements
266 D. Supervisory Board and Managing Board
154 D. Consolidated Statements of Income
155 D. Consolidated Statements of Comprehensive Income
156 D. Consolidated Statements of Financial Position
157 D. Consolidated Statements of Cash Flow
For the purpose of estimating the fair value less costs to sell
of the Divisions or equivalents, cash flows were projected for
the next five years based on past experience, actual operating
results and management’s best estimate about future devel-
opments as well as market assumptions.
The fair value less costs to sell is mainly driven by the termi-
nal value which is particularly sensitive to changes in the as-
sumptions on the terminal value growth rate and discount
rate. Both assumptions are determined individually for each
Division or equivalent. Discount rates reflect the current mar-
ket assessment of the risks specific to each Division or equiva-
lent and are based on the weighted average cost of capital for
the Divisions or equivalents (for SFS the discount rate repre-
sents cost of equity). Terminal value growth rates take into
consideration external macroeconomic sources of data and
industry specific trends.
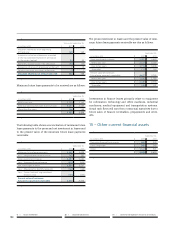
The following table presents the key assumptions used to de-
termine fair value less costs to sell for impairment test pur-
poses for the Divisions to which a significant amount of good-
will is allocated:
Year ended September ,
Goodwill
Terminal
value
growth rate
After-tax
discount
rate
(in millions of €)
Diagnostics of the
Healthcare Sector 4,780 2.25% 7.0%
Imaging & Therapy Systems
of the Healthcare Sector 2,506 2.7% 7.0%
Industry Automation
of the Industry Sector 2,299 2.0% 8.5%
1 In fiscal , Imaging & IT of the Healthcare Sector
Year ended September ,
Goodwill
Terminal
value
growth rate
After-tax
discount
rate
(in millions of €)
Diagnostics of the
Healthcare Sector 4,727 2.25% 7.0%
Imaging & IT
of the Healthcare Sector 2,911 2.7% 7.0%
Industry Automation
of the Industry Sector 2,266 2.0% 8.0%
As of the third quarter of fiscal , a separate monitoring of
the Solar Thermal Energy (STE) business within the Renew-
able Energy Division was initiated, amongst others, due to the
different business and market patterns in comparison to the
wind power business. Accordingly, the annual impairment
test for goodwill as of September , was performed at a
lower level than the Renewable Energy Division.
The annual test for impairment of goodwill of the solar and
hydro business within the Energy Sector was performed as of
September , . As a result, in the solar and hydro busi-
ness of the Energy Sector an impairment loss of € million
was recognized. The goodwill impaired is mainly attributable
to the acquisition of Siemens Concentrated Solar Power Ltd.
(former Solel Solar Systems Ltd.).
As a result of a market assessment, which was completed in
the three months ended September , , the growth pros-
pects and the long-term market development for the concen-
trated solar power business have been reassessed and the un-
derlying business planning has been adjusted accordingly to
reflect expected lower growth prospects. Cash flows were
discounted at a rate of .%, whereas cash flows beyond the
five-year planning period were extrapolated using a constant
growth rate of .%. The main reason for the deteriorated mar-
ket perspective is a shift from STE technology to Photovoltaic
technology, in particular in the U.S. market. The adjusted
business plan resulting from the market assessment was the
basis for the annual goodwill impairment test in the three
months ended September , .
In fiscal , the annual test for impairment of goodwill of
the Diagnostics Division within the Healthcare Sector was
performed as of September , . As a result, in the Diag-
nostics Division of the Healthcare Sector an impairment of
€, million was recognized to reduce the carrying amount
of goodwill. The Diagnostics Division is based on the acquisi-
tions of Diagnostic Products Corporation (DPC), the Diagnos-
tics Division of Bayer AG and the acquisition of Dade Behring,
Inc. The Division operates in the global healthcare market for
diagnostic testing systems and consumables which faces in-
creasing cost restraints but is estimated to still represent a
growing market mainly due to the megatrend demographic
change. While the cost targets associated with the integration
of the acquired three companies were met, the growth targets
have not been achieved.