Siemens 2011 Annual Report Download - page 285
Download and view the complete annual report
Please find page 285 of the 2011 Siemens annual report below. You can navigate through the pages in the report by either clicking on the pages listed below, or by using the keyword search tool below to find specific information within the annual report.-
 1
1 -
2
-
3
-
4
-
5
-
6
-
7
-
8
-
9
-
10
-
11
-
12
-
13
-
14
-
15
-
16
-
17
-
18
-
19
-
20
-
21
-
22
-
23
-
24
-
25
-
26
-
27
-
28
-
29
-
30
-
31
-
32
-
33
-
34
-
35
-
36
-
37
-
38
-
39
-
40
-
41
-
42
-
43
-
44
-
45
-
46
-
47
-
48
-
49
-
50
-
51
-
52
-
53
-
54
-
55
-
56
-
57
-
58
-
59
-
60
-
61
-
62
-
63
-
64
-
65
-
66
-
67
-
68
-
69
-
70
-
71
-
72
-
73
-
74
-
75
-
76
-
77
-
78
-
79
-
80
-
81
-
82
-
83
-
84
-
85
-
86
-
87
-
88
-
89
-
90
-
91
-
92
-
93
-
94
-
95
-
96
-
97
-
98
-
99
-
100
-
101
-
102
-
103
-
104
-
105
-
106
-
107
-
108
-
109
-
110
-
111
-
112
-
113
-
114
-
115
-
116
-
117
-
118
-
119
-
120
-
121
-
122
-
123
-
124
-
125
-
126
-
127
-
128
-
129
-
130
-
131
-
132
-
133
-
134
-
135
-
136
-
137
-
138
-
139
-
140
-
141
-
142
-
143
-
144
-
145
-
146
-
147
-
148
-
149
-
150
-
151
-
152
-
153
-
154
-
155
-
156
-
157
-
158
-
159
-
160
-
161
-
162
-
163
-
164
-
165
-
166
-
167
-
168
-
169
-
170
-
171
-
172
-
173
-
174
-
175
-
176
-
177
-
178
-
179
-
180
-
181
-
182
-
183
-
184
-
185
-
186
-
187
-
188
-
189
-
190
-
191
-
192
-
193
-
194
-
195
-
196
-
197
-
198
-
199
-
200
-
201
-
202
-
203
-
204
-
205
-
206
-
207
-
208
-
209
-
210
-
211
-
212
-
213
-
214
-
215
-
216
-
217
-
218
-
219
-
220
-
221
-
222
-
223
-
224
-
225
-
226
-
227
-
228
-
229
-
230
-
231
-
232
-
233
-
234
-
235
-
236
-
237
-
238
-
239
-
240
-
241
-
242
-
243
-
244
-
245
-
246
-
247
-
248
-
249
-
250
-
251
-
252
-
253
-
254
-
255
-
256
-
257
-
258
-
259
-
260
-
261
-
262
-
263
-
264
-
265
-
266
-
267
-
268
-
269
-
270
-
271
-
272
-
273
-
274
-
 275
275 -
 276
276 -
 277
277 -
 278
278 -
 279
279 -
 280
280 -
 281
281 -
 282
282 -
 283
283 -
 284
284 -
 285
285 -
 286
286 -
 287
287 -
 288
288 -
 289
289 -
 290
290 -
 291
291 -
 292
292 -
 293
293 -
 294
294 -
 295
295 -
296
-
297
-
298
-
299
-
300
-
301
-
302
-
303
-
304
-
305
-
306
-
307
-
308
-
309
-
310
-
311
-
312
-
313
-
314
-
315
-
316
-
317
-
318
-
319
-
320
-
321
-
322
-
323
-
324
-
325
-
326
-
327
-
328
-
329
-
330
-
331
-
332
-
333
-
334
-
335
-
336
-
337
-
338
-
339
-
340
-
341
-
342
-
343
-
344
-
345
-
346
-
347
-
348
-
349
-
350
-
351
-
352
-
353
-
354
-
355
-
356
-
357
-
358
-
359
-
360
-
361
-
362
-
363
-
364
-
365
-
366
-
367
-
368
-
369
-
370
-
371
-
372
-
373
-
374
-
375
-
376
-
377
-
378
-
379
-
380
-
381
-
382
-
383
-
384
-
385
-
386
-
387
-
388
 |
 |

153 D. Consolidated Financial Statements 273 E. Additional information
158 D. Consolidated Statements of Changes in Equity
160 D. Notes to Consolidated Financial Statements
266 D. Supervisory Board and Managing Board
154 D. Consolidated Statements of Income
155 D. Consolidated Statements of Comprehensive Income
156 D. Consolidated Statements of Financial Position
157 D. Consolidated Statements of Cash Flow
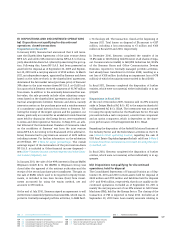
The deferred tax expense (benefit) in fiscal and in-
cludes tax effects of the origination and reversal of temporary
differences of € million and €() million.
In Germany, the calculation of current tax is based on a corpo-
rate tax rate of % and a solidarity surcharge thereon of .%,
for all distributed and retained earnings. In addition to corpo-
rate taxation, trade tax is levied on profits earned in Germany.
As the German trade tax is a non deductible expense, the av-
erage trade tax rate amounts to % and the combined total
tax rate results in %. Deferred tax assets and liabilities are
measured at tax rates that are expected to apply to the period
when the asset is realized or the liability is settled.
For foreign subsidiaries, current taxes are calculated based on
the local tax laws and applicable tax rates in the individual
foreign countries. Deferred tax assets and liabilities are mea-
sured at the tax rates that are expected to apply to the period
when the asset is realized or the liability is settled.
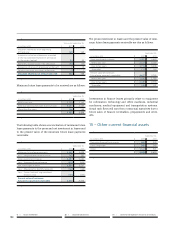
Income tax expense differs from the amounts computed by
applying a combined statutory German income tax rate of %
as follows:
Year ended September ,
(in millions of €)
Expected income tax expense 2,865 1,852
Increase (decrease) in
income taxes resulting from:
Non-deductible losses and expenses 376 660
Tax-free income (929) (288)
Taxes for prior years (9) (300)
Change in realizability of
deferred tax assets and tax credits 24 (27)
Change in tax rates (9) 10
Foreign tax rate differential (64) (203)
Tax effect of investments
accounted for using the equity method (24) 6
Other, net 12
Actual income tax expense 2,231 1,712
The tax free income in Fiscal is mainly attributable to the
Areva NP S.A.S. disposal.
In fiscal the non-tax deductible losses and expenses are
mainly attributable to the goodwill impairment of the Diag-
nostics Division of the Healthcare Sector, which is only partly
tax-deductible.
Deferred income tax assets and liabilities on a gross basis are
summarized as follows:
Year ended September ,
(in millions of €)
Assets:
Financial assets 79 12
Other intangible assets 254 297
Property, plant and equipment 273 305
Inventories 528 528
Receivables 486 994
Pension plans and similar commitments 2,387 2,674
Provisions 1,538 1,835
Liabilities 2,341 2,645
Tax loss and credit carryforward 2,058 1,971
Other 191 312
Deferred tax assets 10,135 11,573
Liabilities:
Financial assets 162 189
Other intangible assets 1,451 1,357
Property, plant and equipment 796 787
Inventories 1,974 2,112
Receivables 1,930 2,413
Provisions 718 800
Liabilities 144 265
Other 349 287
Deferred tax liabilities 7,524 8,210
Total deferred tax assets, net 2,611 3,363
In assessing the realizability of deferred tax assets, manage-
ment considers the extent to which it is probable that the de-
ferred tax asset will be realized. The ultimate realization of de-
ferred tax assets is dependent upon the generation of future
taxable profits during the periods in which those temporary
differences and tax loss carryforwards become deductible.
Management considers the expected reversal of deferred tax
liabilities and projected future taxable income in making this
assessment. Based upon the level of historical taxable income