Siemens 2011 Annual Report Download - page 204
Download and view the complete annual report
Please find page 204 of the 2011 Siemens annual report below. You can navigate through the pages in the report by either clicking on the pages listed below, or by using the keyword search tool below to find specific information within the annual report.-
 1
1 -
2
-
3
-
4
-
5
-
6
-
7
-
8
-
9
-
10
-
11
-
12
-
13
-
14
-
15
-
16
-
17
-
18
-
19
-
20
-
21
-
22
-
23
-
24
-
25
-
26
-
27
-
28
-
29
-
30
-
31
-
32
-
33
-
34
-
35
-
36
-
37
-
38
-
39
-
40
-
41
-
42
-
43
-
44
-
45
-
46
-
47
-
48
-
49
-
50
-
51
-
52
-
53
-
54
-
55
-
56
-
57
-
58
-
59
-
60
-
61
-
62
-
63
-
64
-
65
-
66
-
67
-
68
-
69
-
70
-
71
-
72
-
73
-
74
-
75
-
76
-
77
-
78
-
79
-
80
-
81
-
82
-
83
-
84
-
85
-
86
-
87
-
88
-
89
-
90
-
91
-
92
-
93
-
94
-
95
-
96
-
97
-
98
-
99
-
100
-
101
-
102
-
103
-
104
-
105
-
106
-
107
-
108
-
109
-
110
-
111
-
112
-
113
-
114
-
115
-
116
-
117
-
118
-
119
-
120
-
121
-
122
-
123
-
124
-
125
-
126
-
127
-
128
-
129
-
130
-
131
-
132
-
133
-
134
-
135
-
136
-
137
-
138
-
139
-
140
-
141
-
142
-
143
-
144
-
145
-
146
-
147
-
148
-
149
-
150
-
151
-
152
-
153
-
154
-
155
-
156
-
157
-
158
-
159
-
160
-
161
-
162
-
163
-
164
-
165
-
166
-
167
-
168
-
169
-
170
-
171
-
172
-
173
-
174
-
175
-
176
-
177
-
178
-
179
-
180
-
181
-
182
-
183
-
184
-
185
-
186
-
187
-
188
-
189
-
190
-
191
-
192
-
193
-
 194
194 -
 195
195 -
 196
196 -
 197
197 -
 198
198 -
 199
199 -
 200
200 -
 201
201 -
 202
202 -
 203
203 -
 204
204 -
 205
205 -
 206
206 -
 207
207 -
 208
208 -
 209
209 -
 210
210 -
 211
211 -
 212
212 -
 213
213 -
 214
214 -
215
-
216
-
217
-
218
-
219
-
220
-
221
-
222
-
223
-
224
-
225
-
226
-
227
-
228
-
229
-
230
-
231
-
232
-
233
-
234
-
235
-
236
-
237
-
238
-
239
-
240
-
241
-
242
-
243
-
244
-
245
-
246
-
247
-
248
-
249
-
250
-
251
-
252
-
253
-
254
-
255
-
256
-
257
-
258
-
259
-
260
-
261
-
262
-
263
-
264
-
265
-
266
-
267
-
268
-
269
-
270
-
271
-
272
-
273
-
274
-
275
-
276
-
277
-
278
-
279
-
280
-
281
-
282
-
283
-
284
-
285
-
286
-
287
-
288
-
289
-
290
-
291
-
292
-
293
-
294
-
295
-
296
-
297
-
298
-
299
-
300
-
301
-
302
-
303
-
304
-
305
-
306
-
307
-
308
-
309
-
310
-
311
-
312
-
313
-
314
-
315
-
316
-
317
-
318
-
319
-
320
-
321
-
322
-
323
-
324
-
325
-
326
-
327
-
328
-
329
-
330
-
331
-
332
-
333
-
334
-
335
-
336
-
337
-
338
-
339
-
340
-
341
-
342
-
343
-
344
-
345
-
346
-
347
-
348
-
349
-
350
-
351
-
352
-
353
-
354
-
355
-
356
-
357
-
358
-
359
-
360
-
361
-
362
-
363
-
364
-
365
-
366
-
367
-
368
-
369
-
370
-
371
-
372
-
373
-
374
-
375
-
376
-
377
-
378
-
379
-
380
-
381
-
382
-
383
-
384
-
385
-
386
-
387
-
388
 |
 |
6 A. To our shareholders
23 B. Corporate Governance 51 C. Combined management’s discussion and analysis
52 C. Business and operating environment
80 C. Fiscal – Financial summary
83 C. Results of operations
101 C. Financial position
114 C. Net assets position
117 C. Overall assessment of the economic position
118 C. Report on post-balance sheet date events
119 C. Report on expected developments and
associated material opportunities and risks
135 C. Information required pursuant to Section ()
and Section () of the German Commercial
Code (HGB) and explanatory report
C.. Cash flow –
Fiscal compared to fiscal
The following discussion presents an analysis of our cash flows
for fiscal and for both continuing and discontinued
operations. Discontinued operations include primarily OSRAM
and Siemens IT Solutions and Services, which were classified
as discontinued operations during the second quarter of fiscal
. Prior periods are presented on a comparable basis.
We report Free cash flow as a supplemental liquidity measure,
which is defined as net cash provided by (used in) operating
activities less cash used for additions to intangible assets and
property, plant and equipment. We believe that the presenta-
tion of Free cash flow provides useful information to investors
because it gives an indication of the long-term cash-generat-
ing ability of our business and our ability to pay for discretion-
ary and non-discretionary expenditures not included in the
measure, such as dividends, debt repayment or acquisitions.
We also use Free cash flow to compare cash generation among
the segments of our business. Free cash flow should not be
considered in isolation or as an alternative to measures of
cash flow calculated in accordance with IFRS. For further in-
formation about the usefulness and limitations of this mea-
sure see C. Notes and forward-looking statements.
Cash flows from operating activities – Operating activities
in continuing and discontinued operations provided net cash
of €. billion in fiscal , compared to net cash provided
of €. billion a year earlier.
Within the total, continuing operations provided net cash of
€. billion the current period, compared to net cash pro-
vided of €. billion in fiscal . The decrease in cash flow
from operating activities was due primarily to an increase in
net working capital in Total Sectors associated with growth
partly offset by cash inflows driven by an increase in Siemens’
profit supported by an increase of % in Total Sectors profit.
The major factor within net working capital was an increased
build-up in inventories, primarily in the Energy Sector.
For
comparison, net working capital in the Total Sectors decreased
a year earlier. Fiscal included cash outflows for personnel-
related expenses of €. billion in connection with the previ-
ously disclosed special remuneration for non-management
employees. For comparison, fiscal included higher cash
outflows related to staff reduction measures. Lower income
taxes paid in fiscal were more than compensated by lower
dividends received which related mainly to our investment in
BSH and higher pension funding relating to our pension plans
and similar commitments compared to the prior year.
Discontinued operations used net cash of € million in fis-
cal , compared to net cash provided of € million a year
earlier. The current period included primarily cash outflows
related to establishing Siemens IT Solutions and Services as a
separate legal group, including for carve-out activities and
personnel-related matters partly offset by cash inflows from
OSRAM’s operating activities.
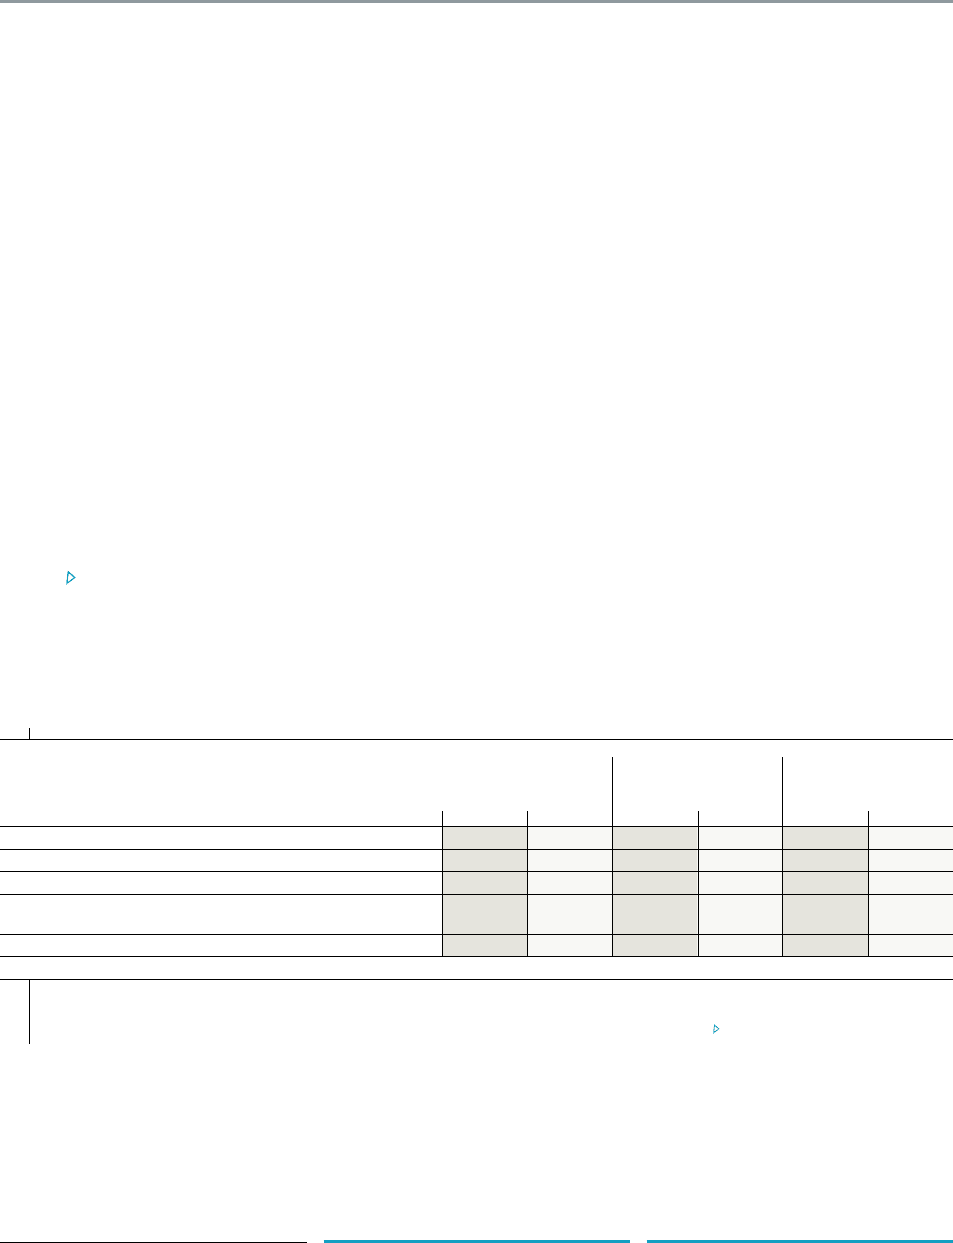
Free cash flow
Continuing operations Discontinued operations Continuing and
discontinued operations
Year ended September , Year ended September , Year ended September ,
(in millions of €)
Net cash provided by (used in):
Operating activities A8,056 8,997 (289) 352 7,767 9,349
Investing activities (2,909) (2,315) (1,135) (532) (4,044) (2,847)
therein: Additions to intangible assets and
property, plant and equipment B(2,171) (1,954) (446) (382) (2,617) (2,336)
Free cash flow , A+B 5,885 7,043 (735) (30) 5,150 7,013
1 For information regarding Net cash provided by (used in) financing activities please refer to the discussion below.
2 The closest comparable financial measure of Free cash flow under IFRS is Net cash provided by (used in) operating activities. Net cash provided by (used in) operating activities from
continuing operations as well as from continuing and discontinued operations is reported in our Consolidated Statements of Cash Flow. Additions to intangible assets and property,
plant and equipment from continuing operations is reconciled to the figures as reported in the Consolidated Statements of Cash Flow in D. Notes to Consolidated Financial State-
ments. Other companies that report Free cash flow may define and calculate this measure differently.