Siemens 2011 Annual Report Download - page 283
Download and view the complete annual report
Please find page 283 of the 2011 Siemens annual report below. You can navigate through the pages in the report by either clicking on the pages listed below, or by using the keyword search tool below to find specific information within the annual report.-
 1
1 -
2
-
3
-
4
-
5
-
6
-
7
-
8
-
9
-
10
-
11
-
12
-
13
-
14
-
15
-
16
-
17
-
18
-
19
-
20
-
21
-
22
-
23
-
24
-
25
-
26
-
27
-
28
-
29
-
30
-
31
-
32
-
33
-
34
-
35
-
36
-
37
-
38
-
39
-
40
-
41
-
42
-
43
-
44
-
45
-
46
-
47
-
48
-
49
-
50
-
51
-
52
-
53
-
54
-
55
-
56
-
57
-
58
-
59
-
60
-
61
-
62
-
63
-
64
-
65
-
66
-
67
-
68
-
69
-
70
-
71
-
72
-
73
-
74
-
75
-
76
-
77
-
78
-
79
-
80
-
81
-
82
-
83
-
84
-
85
-
86
-
87
-
88
-
89
-
90
-
91
-
92
-
93
-
94
-
95
-
96
-
97
-
98
-
99
-
100
-
101
-
102
-
103
-
104
-
105
-
106
-
107
-
108
-
109
-
110
-
111
-
112
-
113
-
114
-
115
-
116
-
117
-
118
-
119
-
120
-
121
-
122
-
123
-
124
-
125
-
126
-
127
-
128
-
129
-
130
-
131
-
132
-
133
-
134
-
135
-
136
-
137
-
138
-
139
-
140
-
141
-
142
-
143
-
144
-
145
-
146
-
147
-
148
-
149
-
150
-
151
-
152
-
153
-
154
-
155
-
156
-
157
-
158
-
159
-
160
-
161
-
162
-
163
-
164
-
165
-
166
-
167
-
168
-
169
-
170
-
171
-
172
-
173
-
174
-
175
-
176
-
177
-
178
-
179
-
180
-
181
-
182
-
183
-
184
-
185
-
186
-
187
-
188
-
189
-
190
-
191
-
192
-
193
-
194
-
195
-
196
-
197
-
198
-
199
-
200
-
201
-
202
-
203
-
204
-
205
-
206
-
207
-
208
-
209
-
210
-
211
-
212
-
213
-
214
-
215
-
216
-
217
-
218
-
219
-
220
-
221
-
222
-
223
-
224
-
225
-
226
-
227
-
228
-
229
-
230
-
231
-
232
-
233
-
234
-
235
-
236
-
237
-
238
-
239
-
240
-
241
-
242
-
243
-
244
-
245
-
246
-
247
-
248
-
249
-
250
-
251
-
252
-
253
-
254
-
255
-
256
-
257
-
258
-
259
-
260
-
261
-
262
-
263
-
264
-
265
-
266
-
267
-
268
-
269
-
270
-
271
-
272
-
 273
273 -
 274
274 -
 275
275 -
 276
276 -
 277
277 -
 278
278 -
 279
279 -
 280
280 -
 281
281 -
 282
282 -
 283
283 -
 284
284 -
 285
285 -
 286
286 -
 287
287 -
 288
288 -
 289
289 -
 290
290 -
 291
291 -
 292
292 -
 293
293 -
294
-
295
-
296
-
297
-
298
-
299
-
300
-
301
-
302
-
303
-
304
-
305
-
306
-
307
-
308
-
309
-
310
-
311
-
312
-
313
-
314
-
315
-
316
-
317
-
318
-
319
-
320
-
321
-
322
-
323
-
324
-
325
-
326
-
327
-
328
-
329
-
330
-
331
-
332
-
333
-
334
-
335
-
336
-
337
-
338
-
339
-
340
-
341
-
342
-
343
-
344
-
345
-
346
-
347
-
348
-
349
-
350
-
351
-
352
-
353
-
354
-
355
-
356
-
357
-
358
-
359
-
360
-
361
-
362
-
363
-
364
-
365
-
366
-
367
-
368
-
369
-
370
-
371
-
372
-
373
-
374
-
375
-
376
-
377
-
378
-
379
-
380
-
381
-
382
-
383
-
384
-
385
-
386
-
387
-
388
 |
 |

153 D. Consolidated Financial Statements 273 E. Additional information
158 D. Consolidated Statements of Changes in Equity
160 D. Notes to Consolidated Financial Statements
266 D. Supervisory Board and Managing Board
154 D. Consolidated Statements of Income
155 D. Consolidated Statements of Comprehensive Income
156 D. Consolidated Statements of Financial Position
157 D. Consolidated Statements of Cash Flow
vestment has been adjusted to reflect the expected lower
growth prospects. The Archimede impairment is based on fair
value less costs to sell applying a discounted cash flow meth-
od, which assumed a post-tax WACC of .% and a terminal
value growth rate of %. As a result, an impairment loss of
€ million was recognized in line item Income (loss) from in-
vestments accounted for using the equity method.
For further information on the Company ’s principal invest-
ments accounted for under the equity method see
Note
19
Investments accounted for using the equity method.
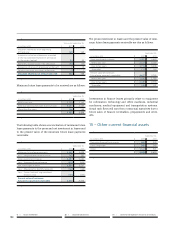
– Interest income, interest expense
and other financial income (expense),
net
Year ended September ,
(in millions of €)
Pension related interest income 1,364 1,283
Interest income, other than pension 843 762
Interest income 2,207 2,045
Pension related interest expense (1,223) (1,333)
Interest expense, other than pension (493) (426)
Interest expense (1,716) (1,759)
Income (expense) from available-for-sale
financial assets, net 854 (4)
Miscellaneous financial income (expense), net (208) (379)
Other financial income (expense), net 646 (383)
The components of item Income (expense) from pension
plans and similar commitments, net were as follows:
Year ended September ,
(in millions of €)
Expected return on plan assets 1,364 1,283
Interest cost (1,223) (1,333)
Income (expense) from pension plans
and similar commitments, net 141 (50)
Total amounts of item Interest income and (expense), other
than pension, were as follows:
Year ended September ,
(in millions of €)
Interest income, other than pension 843 762
Interest (expense), other than pension (493) (426)
Interest income (expense), net,
other than pension 350 336
Thereof: Interest income
(expense) of Operations, net (26) 19
Thereof: Other interest income
(expense), net 376 317
Item Interest income (expense) of Operations, net includes in-
terest income and expense primarily related to receivables
from customers and payables to suppliers, interest on advanc-
es from customers and advanced financing of customer con-
tracts. Item Other interest income (expense), net includes all
other interest amounts primarily consisting of interest relat-
ing to corporate debt, and related hedging activities, as well
as interest income on corporate assets.
Item Interest income (expense) other than pension includes
the following with respect to financial assets (financial liabili-
ties) not at fair value through profit or loss:
Year ended September ,
(in millions of €)
Total interest income on financial assets 833 747
Total interest expenses on financial liabilities (960) (999)
1 Relating to hedged positions, herein only the interest expense on hedged
items not at fair value through profit and loss is included, whereas item Interest
expense, other than pension also contains the offsetting effect on interest of
the hedging instrument. The difference is due to the disparities of interest rate
swap contracts further explained in Note 32 Derivative financial instruments and
hedging activities – Fair value hedges of fixed-rate debt obligations.