Siemens 2014 Annual Report Download - page 181
Download and view the complete annual report
Please find page 181 of the 2014 Siemens annual report below. You can navigate through the pages in the report by either clicking on the pages listed below, or by using the keyword search tool below to find specific information within the annual report.-
 1
1 -
2
-
3
-
4
-
5
-
6
-
7
-
8
-
9
-
10
-
11
-
12
-
13
-
14
-
15
-
16
-
17
-
18
-
19
-
20
-
21
-
22
-
23
-
24
-
25
-
26
-
27
-
28
-
29
-
30
-
31
-
32
-
33
-
34
-
35
-
36
-
37
-
38
-
39
-
40
-
41
-
42
-
43
-
44
-
45
-
46
-
47
-
48
-
49
-
50
-
51
-
52
-
53
-
54
-
55
-
56
-
57
-
58
-
59
-
60
-
61
-
62
-
63
-
64
-
65
-
66
-
67
-
68
-
69
-
70
-
71
-
72
-
73
-
74
-
75
-
76
-
77
-
78
-
79
-
80
-
81
-
82
-
83
-
84
-
85
-
86
-
87
-
88
-
89
-
90
-
91
-
92
-
93
-
94
-
95
-
96
-
97
-
98
-
99
-
100
-
101
-
102
-
103
-
104
-
105
-
106
-
107
-
108
-
109
-
110
-
111
-
112
-
113
-
114
-
115
-
116
-
117
-
118
-
119
-
120
-
121
-
122
-
123
-
124
-
125
-
126
-
127
-
128
-
129
-
130
-
131
-
132
-
133
-
134
-
135
-
136
-
137
-
138
-
139
-
140
-
141
-
142
-
143
-
144
-
145
-
146
-
147
-
148
-
149
-
150
-
151
-
152
-
153
-
154
-
155
-
156
-
157
-
158
-
159
-
160
-
161
-
162
-
163
-
164
-
165
-
166
-
167
-
168
-
169
-
170
-
 171
171 -
 172
172 -
 173
173 -
 174
174 -
 175
175 -
 176
176 -
 177
177 -
 178
178 -
 179
179 -
 180
180 -
 181
181 -
 182
182 -
 183
183 -
 184
184 -
 185
185 -
 186
186 -
 187
187 -
 188
188 -
 189
189 -
 190
190 -
 191
191 -
192
-
193
-
194
-
195
-
196
-
197
-
198
-
199
-
200
-
201
-
202
-
203
-
204
-
205
-
206
-
207
-
208
-
209
-
210
-
211
-
212
-
213
-
214
-
215
-
216
-
217
-
218
-
219
-
220
-
221
-
222
-
223
-
224
-
225
-
226
-
227
-
228
-
229
-
230
-
231
-
232
-
233
-
234
-
235
-
236
-
237
-
238
-
239
-
240
-
241
-
242
-
243
-
244
-
245
-
246
-
247
-
248
-
249
-
250
-
251
-
252
-
253
-
254
-
255
-
256
-
257
-
258
-
259
-
260
-
261
-
262
-
263
-
264
-
265
-
266
-
267
-
268
-
269
-
270
-
271
-
272
-
273
-
274
-
275
-
276
-
277
-
278
-
279
-
280
-
281
-
282
-
283
-
284
-
285
-
286
-
287
-
288
-
289
-
290
-
291
-
292
-
293
-
294
-
295
-
296
-
297
-
298
-
299
-
300
-
301
-
302
-
303
-
304
-
305
-
306
-
307
-
308
-
309
-
310
-
311
-
312
-
313
-
314
-
315
-
316
-
317
-
318
-
319
-
320
-
321
-
322
-
323
-
324
-
325
-
326
-
327
-
328
-
329
-
330
-
331
-
332
-
333
-
334
-
335
-
336
-
337
-
338
-
339
-
340
-
341
-
342
-
343
-
344
-
345
-
346
-
347
-
348
 |
 |
247 D. Consolidated Financial Statements
337 E. Additional Information
213 C. Overall assessment of the economic position
214 C. Subsequent events
215 C. Sustainability and citizenship
225 C. Report on expected developments and
associated material opportunities and risks
242 C. Compensation Report and legal disclosures
242 C. Siemens AG (Discussion on basis
of German Commercial Code)
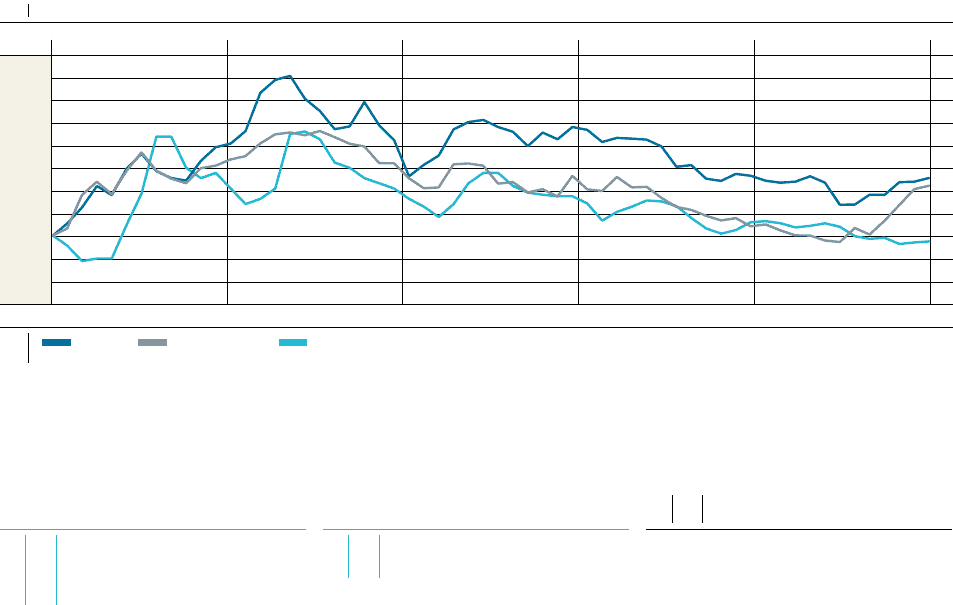
were still % lower in fiscal than the average for fiscal
, reflecting modest demand during fiscal .
Average monthly prices of aluminum traded on the London
Metal Exchange recently rebounded and were % higher
in September compared to September . Prices on a
fiscal- year average were nevertheless % lower in fiscal
than the average of fiscal . Significantly rising premiums
for physically delivered aluminum have added to the prices of
the London Metal Exchange contracts. The aluminum industry
is in a situation of a global oversupply due to rapid expansion
of capacities, while regional markets in the western world face
a tighter supply.
The average monthly steel prices for September declined
by % compared to the average monthly prices in Septem-
ber . Prices on a fiscal-year average were % lower in fiscal
than the average for fiscal .
Our main exposure to the prices of copper, aluminum and
related products is in the new Divisions Energy Management
and Process Industries and Drives. Our main price exposure
related to carbon steel and stainless steel is in our new Divi-
sions Power and Gas and Wind Power and Renewables. In addi-
tion, Siemens is generally exposed to energy and fuel prices,
both directly (electricity, gas, oil) and indirectly (energy used
in the manufacturing processes of suppliers, fuels included in
logistics costs).
Siemens employs various strategies to reduce the price risk in
its project and product businesses, such as long-term contract-
ing with suppliers, physical and financial hedging and price
escalation clauses with customers.
C... MARKET DEVELOPMENT
In fiscal , the addressed market of our Energy Sector devel-
oped stable year-over-year. Wind power markets showed the
strongest growth (both onshore and offshore). Markets for
power transmission grew slightly while market volume for
large gas turbines declined year-over-year.
Markets of the Power Generation Division declined in fiscal
compared to fiscal . In particular the advanced gas
turbine market remained difficult with a market size in fiscal
clearly below fiscal . In addition, production over-
capacities have been resulting in increased price pressure.
During the fiscal year, the overall market environment for fossil
power generation faced project shifts in various regions lead-
ing to tough competition. While key countries such as the
U.S. or China have been facing market delays, countries of the
Middle East, especially Saudi-Arabia showed higher invest-
ments in gas-fired power plants year-over-year. Demand for
industrial gas and steam turbines developed roughly flat.
Markets served by our Wind Power Division grew clearly in fis-
cal fueled by strong demand in Europe, which is the most
mature geographic market in the world for onshore and off-
shore wind power. In particular, Europe is home to almost all
offshore installations currently active worldwide. Within the
Americas, growth in the U.S. was driven by onshore wind proj-
ects, following the extension of an existing production tax
credit (PTC) for renewable energy into the first quarter of fiscal
. Market development in the Asia, Australia region was
characterized by intense local competition, particularly in
China. While China has the largest wind market in the world,
market access for foreign companies remains to be very diffi-
cult and limited. The competitive situation in the wind power
Development of raw material prices (Index: Beginning of fiscal = )
FY FY FY FY FY
Copper Aluminium (HG) Steel HRC
Source: London Metal Exchange (LME) for copper and aluminium, CRU HRC Germany for steel; cash prices in € per ton.