Siemens 2014 Annual Report Download - page 299
Download and view the complete annual report
Please find page 299 of the 2014 Siemens annual report below. You can navigate through the pages in the report by either clicking on the pages listed below, or by using the keyword search tool below to find specific information within the annual report.-
 1
1 -
2
-
3
-
4
-
5
-
6
-
7
-
8
-
9
-
10
-
11
-
12
-
13
-
14
-
15
-
16
-
17
-
18
-
19
-
20
-
21
-
22
-
23
-
24
-
25
-
26
-
27
-
28
-
29
-
30
-
31
-
32
-
33
-
34
-
35
-
36
-
37
-
38
-
39
-
40
-
41
-
42
-
43
-
44
-
45
-
46
-
47
-
48
-
49
-
50
-
51
-
52
-
53
-
54
-
55
-
56
-
57
-
58
-
59
-
60
-
61
-
62
-
63
-
64
-
65
-
66
-
67
-
68
-
69
-
70
-
71
-
72
-
73
-
74
-
75
-
76
-
77
-
78
-
79
-
80
-
81
-
82
-
83
-
84
-
85
-
86
-
87
-
88
-
89
-
90
-
91
-
92
-
93
-
94
-
95
-
96
-
97
-
98
-
99
-
100
-
101
-
102
-
103
-
104
-
105
-
106
-
107
-
108
-
109
-
110
-
111
-
112
-
113
-
114
-
115
-
116
-
117
-
118
-
119
-
120
-
121
-
122
-
123
-
124
-
125
-
126
-
127
-
128
-
129
-
130
-
131
-
132
-
133
-
134
-
135
-
136
-
137
-
138
-
139
-
140
-
141
-
142
-
143
-
144
-
145
-
146
-
147
-
148
-
149
-
150
-
151
-
152
-
153
-
154
-
155
-
156
-
157
-
158
-
159
-
160
-
161
-
162
-
163
-
164
-
165
-
166
-
167
-
168
-
169
-
170
-
171
-
172
-
173
-
174
-
175
-
176
-
177
-
178
-
179
-
180
-
181
-
182
-
183
-
184
-
185
-
186
-
187
-
188
-
189
-
190
-
191
-
192
-
193
-
194
-
195
-
196
-
197
-
198
-
199
-
200
-
201
-
202
-
203
-
204
-
205
-
206
-
207
-
208
-
209
-
210
-
211
-
212
-
213
-
214
-
215
-
216
-
217
-
218
-
219
-
220
-
221
-
222
-
223
-
224
-
225
-
226
-
227
-
228
-
229
-
230
-
231
-
232
-
233
-
234
-
235
-
236
-
237
-
238
-
239
-
240
-
241
-
242
-
243
-
244
-
245
-
246
-
247
-
248
-
249
-
250
-
251
-
252
-
253
-
254
-
255
-
256
-
257
-
258
-
259
-
260
-
261
-
262
-
263
-
264
-
265
-
266
-
267
-
268
-
269
-
270
-
271
-
272
-
273
-
274
-
275
-
276
-
277
-
278
-
279
-
280
-
281
-
282
-
283
-
284
-
285
-
286
-
287
-
288
-
 289
289 -
 290
290 -
 291
291 -
 292
292 -
 293
293 -
 294
294 -
 295
295 -
 296
296 -
 297
297 -
 298
298 -
 299
299 -
 300
300 -
 301
301 -
 302
302 -
 303
303 -
 304
304 -
 305
305 -
 306
306 -
 307
307 -
 308
308 -
 309
309 -
310
-
311
-
312
-
313
-
314
-
315
-
316
-
317
-
318
-
319
-
320
-
321
-
322
-
323
-
324
-
325
-
326
-
327
-
328
-
329
-
330
-
331
-
332
-
333
-
334
-
335
-
336
-
337
-
338
-
339
-
340
-
341
-
342
-
343
-
344
-
345
-
346
-
347
-
348
 |
 |
247 D. Consolidated Financial Statements 337 E. Additional Information
248 D. Consolidated Statements of Income
249 D. Consolidated Statements of Comprehensive Income
250 D. Consolidated Statements of Financial Position
251 D. Consolidated Statements of Cash Flows
252 D. Consolidated Statements of Changes in Equity
254 D. Notes to Consolidated Financial Statements
330 D. Supervisory Board and Managing Board
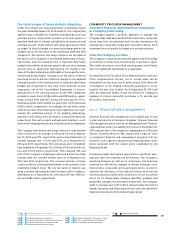
Net gains (losses) of financial instruments are as follows:
Year ended September ,
(in millions of €)
Cash and cash equivalents 19 (1)
Available-for-sale financial assets 29 (99)
Loans and receivables 58 (172)
Financial liabilities measured at amortized cost (844) 408
Financial assets and financial liabilities
held for trading (283) 370
Net gains (losses) in fiscal and on available-for-sale
financial assets include net gains on derecognition as well as
impairment losses.
Net losses on loans and receivables contain changes in valua-
tion allowances, gains or losses on derecognition as well as
recoveries of amounts previously written-off. Net gains (losses)
in fiscal and on financial liabilities measured at amor
-
tized cost are comprised of gains (losses) from derecogni-
tion and the ineffective portion of fair value hedges. Net gains
(losses) in fiscal and on financial assets and financial
liabilities held for trading consist of changes in the fair value of
derivative financial instruments, including interest income and
expense, for which hedge accounting is not applied.
The amounts presented include foreign currency gains and
losses from the realization and valuation of the financial assets
and liabilities mentioned above.
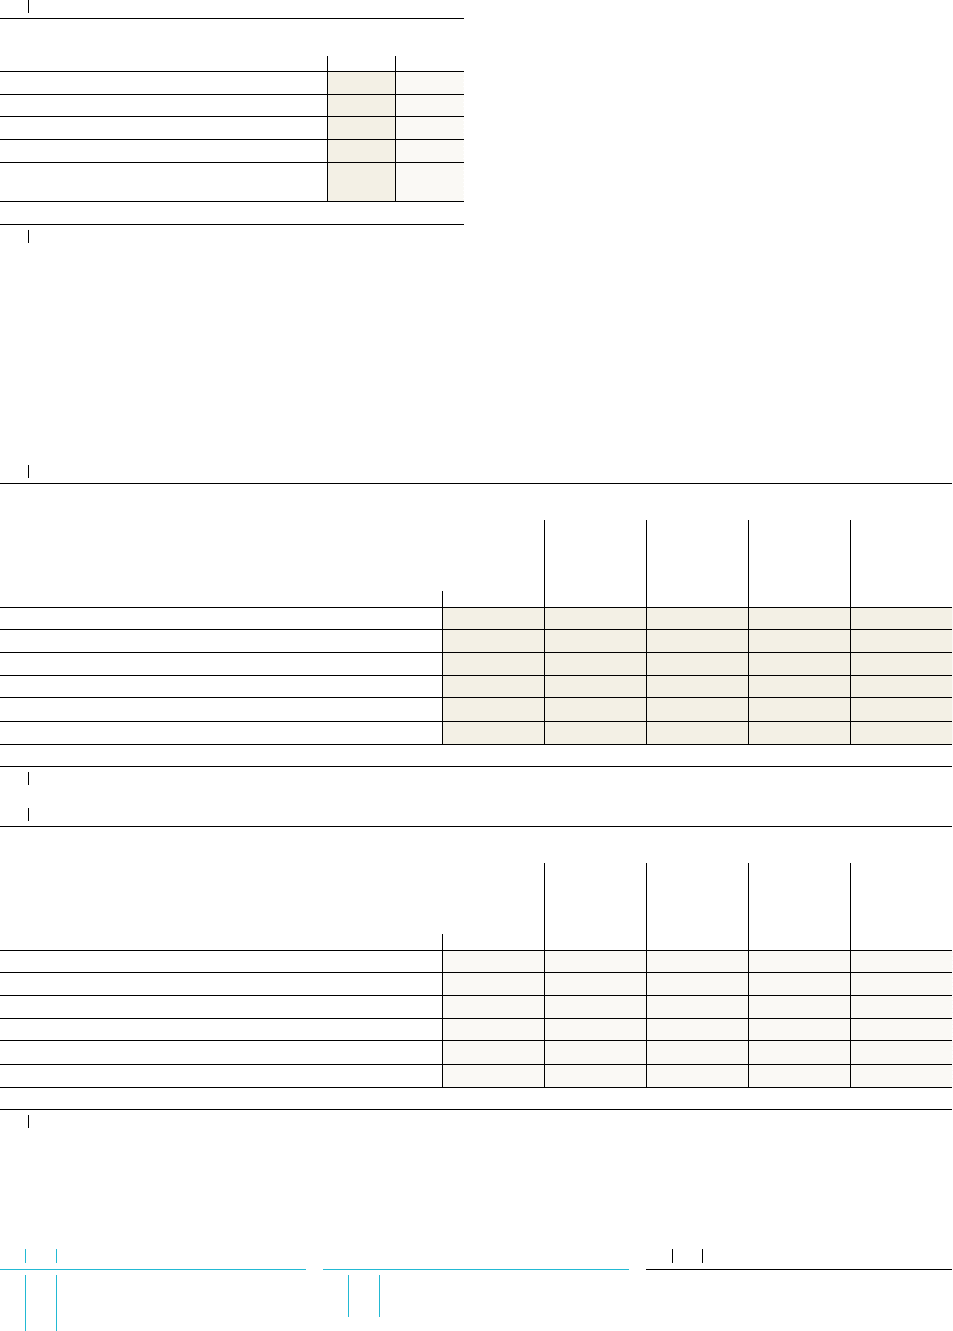
Offsetting
Siemens enters into master netting agreements and similar
agreements for derivative financial instruments and reverse
repurchase agreements. The requirements to offset recognized
financial instruments are usually not met. The following table
reflects financial assets and financial liabilities that are subject
to netting agreements and similar agreements:
September ,
Gross amounts Amounts
set off in the
Statement
of Financial
Position
Net amounts
in the
Statement
of Financial
Position
Related
amounts not
set off in the
Statement
of Financial
Position
Net amounts
(in millions of €)
Financial assets
Derivative financial assets 2,364 7 2,357 955 1,402
Reverse repurchase agreements 400 – 400 400 –
Total 2,764 7 2,757 1,355 1,402
Financial liabilities
Derivative financial liabilities 1,533 7 1,526 905 621
September ,
Gross amounts Amounts
set off in the
Statement
of Financial
Position
Net amounts
in the
Statement
of Financial
Position
Related
amounts not
set off in the
Statement
of Financial
Position
Net amounts
(in millions of €)
Financial assets
Derivative financial assets 2,234 22 2,212 587 1,625
Reverse repurchase agreements 100 – 100 100 –
Total 2,334 22 2,312 687 1,625
Financial liabilities
Derivative financial liabilities 796 22 774 566 208