Siemens 2014 Annual Report Download - page 291
Download and view the complete annual report
Please find page 291 of the 2014 Siemens annual report below. You can navigate through the pages in the report by either clicking on the pages listed below, or by using the keyword search tool below to find specific information within the annual report.-
 1
1 -
2
-
3
-
4
-
5
-
6
-
7
-
8
-
9
-
10
-
11
-
12
-
13
-
14
-
15
-
16
-
17
-
18
-
19
-
20
-
21
-
22
-
23
-
24
-
25
-
26
-
27
-
28
-
29
-
30
-
31
-
32
-
33
-
34
-
35
-
36
-
37
-
38
-
39
-
40
-
41
-
42
-
43
-
44
-
45
-
46
-
47
-
48
-
49
-
50
-
51
-
52
-
53
-
54
-
55
-
56
-
57
-
58
-
59
-
60
-
61
-
62
-
63
-
64
-
65
-
66
-
67
-
68
-
69
-
70
-
71
-
72
-
73
-
74
-
75
-
76
-
77
-
78
-
79
-
80
-
81
-
82
-
83
-
84
-
85
-
86
-
87
-
88
-
89
-
90
-
91
-
92
-
93
-
94
-
95
-
96
-
97
-
98
-
99
-
100
-
101
-
102
-
103
-
104
-
105
-
106
-
107
-
108
-
109
-
110
-
111
-
112
-
113
-
114
-
115
-
116
-
117
-
118
-
119
-
120
-
121
-
122
-
123
-
124
-
125
-
126
-
127
-
128
-
129
-
130
-
131
-
132
-
133
-
134
-
135
-
136
-
137
-
138
-
139
-
140
-
141
-
142
-
143
-
144
-
145
-
146
-
147
-
148
-
149
-
150
-
151
-
152
-
153
-
154
-
155
-
156
-
157
-
158
-
159
-
160
-
161
-
162
-
163
-
164
-
165
-
166
-
167
-
168
-
169
-
170
-
171
-
172
-
173
-
174
-
175
-
176
-
177
-
178
-
179
-
180
-
181
-
182
-
183
-
184
-
185
-
186
-
187
-
188
-
189
-
190
-
191
-
192
-
193
-
194
-
195
-
196
-
197
-
198
-
199
-
200
-
201
-
202
-
203
-
204
-
205
-
206
-
207
-
208
-
209
-
210
-
211
-
212
-
213
-
214
-
215
-
216
-
217
-
218
-
219
-
220
-
221
-
222
-
223
-
224
-
225
-
226
-
227
-
228
-
229
-
230
-
231
-
232
-
233
-
234
-
235
-
236
-
237
-
238
-
239
-
240
-
241
-
242
-
243
-
244
-
245
-
246
-
247
-
248
-
249
-
250
-
251
-
252
-
253
-
254
-
255
-
256
-
257
-
258
-
259
-
260
-
261
-
262
-
263
-
264
-
265
-
266
-
267
-
268
-
269
-
270
-
271
-
272
-
273
-
274
-
275
-
276
-
277
-
278
-
279
-
280
-
 281
281 -
 282
282 -
 283
283 -
 284
284 -
 285
285 -
 286
286 -
 287
287 -
 288
288 -
 289
289 -
 290
290 -
 291
291 -
 292
292 -
 293
293 -
 294
294 -
 295
295 -
 296
296 -
 297
297 -
 298
298 -
 299
299 -
 300
300 -
 301
301 -
302
-
303
-
304
-
305
-
306
-
307
-
308
-
309
-
310
-
311
-
312
-
313
-
314
-
315
-
316
-
317
-
318
-
319
-
320
-
321
-
322
-
323
-
324
-
325
-
326
-
327
-
328
-
329
-
330
-
331
-
332
-
333
-
334
-
335
-
336
-
337
-
338
-
339
-
340
-
341
-
342
-
343
-
344
-
345
-
346
-
347
-
348
 |
 |
247 D. Consolidated Financial Statements 337 E. Additional Information
248 D. Consolidated Statements of Income
249 D. Consolidated Statements of Comprehensive Income
250 D. Consolidated Statements of Financial Position
251 D. Consolidated Statements of Cash Flows
252 D. Consolidated Statements of Changes in Equity
254 D. Notes to Consolidated Financial Statements
330 D. Supervisory Board and Managing Board
indicates the approximate amount of time in years that would
be needed to cover Industrial net debt through continuing
income, without taking into account interest, taxes, deprecia
-
tion and amortization.
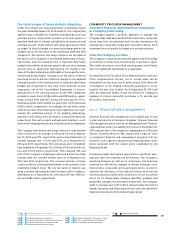
Siemens calculates the item Industrial net debt as set forth in
the table below:
September ,
(in millions of €)
Short-term debt and current maturities of
long-term debt 1,620 1,944
Plus: Long-term debt 19,326 18,509
Less: Cash and cash equivalents (8,013) (9,190)
Less: Current available-for-sale financial assets (925) (601)
Net debt 12,008 10,663
Less: SFS Debt (18,663) (15,600)
Plus: Post-employment benefits 9,324 9,265
Plus: Credit guarantees 774 622
Less: % nominal amount hybrid bond (932) (899)
Less: Fair value hedge accounting adjustment (1,121) (1,247)
Industrial net debt 1,390 2,805
Adjusted EBITDA (continuing operations) 9,139 8,097
Industrial net debt / Adjusted EBITDA
(continuing operations) 0.15 0.35
1 The item Short-term debt and current maturities of long-term debt as well as the
item Long-term debt included, in total, fair value hedge accounting adjustments
of €, million and €, million in fiscal and , respectively.
2 The adjustment considers that both Moody’s and S&P view SFS as a captive finance
company. These rating agencies generally recognize and accept higher levels
of debt attributable to captive finance subsidiaries in determining credit ratings.
Following this concept, Siemens excludes SFS Debt in order to derive an industrial
net debt which is not affected by SFS’s financing activities.
3 To reflect Siemens’ total post-employment benefit liability, industrial net debt
includes line item Post-employment benefits as presented in the Consolidated
Statements of Financial Position.
4 The adjustment for our hybrid bond considers the calculation of this financial ratio
applied by rating agencies to classify % of our hybrid bond as equity and % as
debt. This assignment reflects the characteristics of our hybrid bond such as a long
maturity date and subordination to all senior and debt obligations.
5 Debt is generally reported with a value representing approximately the amount to
be repaid. However, for debt designated in a hedging relationship (fair value
hedges), this amount is adjusted for changes in market value mainly due to changes
in interest rates. Accordingly, Siemens deducts these changes in market value in
order to end up with an amount of debt that approximately will be repaid. Siemens
believes this is a more meaningful figure for the calculation presented above.
SFS’ capital structure differs from the capital structure of
Siemens’ industrial business, as SFS’ business is capital inten-
sive and requires a larger amount of debt to finance its opera-
tions, in particular to finance SFS’s expanding asset base. The
following table provides information on the capital structure of
SFS as of September , and :
September ,
(in millions of €)
Allocated equity 2,148 1,938
SFS debt 18,663 15,600
Debt to equity ratio 8.69 8.05
To measure capital efficiency at SFS, equity capital is allocated
to SFS. Allocated equity capital differs from book capital as it is
mainly determined and influenced by the size and quality of its
portfolio of commercial finance as well as project and struc-
tured finance assets (primarily loans and leases) and equity
investments. This allocation is designed to cover the risks of
the underlying business. The actual risk of the SFS portfolio is
evaluated and controlled on a regular basis.
In November , Siemens announced that Siemens intends
to further optimize the Company’s capital structure through a
share buyback of up to € billion in volume in the time period
until October , . In May , we started to repurchase
shares. The share buyback serves exclusively the purpose of
retiring shares and reducing capital, for issuing shares to
employees, board members of associated companies and mem-
bers of the Managing Board, and for meeting obligations under
convertible and / or warrant bonds. For additional information,
see NOTE EQUITY.
In fiscal , Siemens may again fulfill commitments for
share-based compensation through treasury shares.
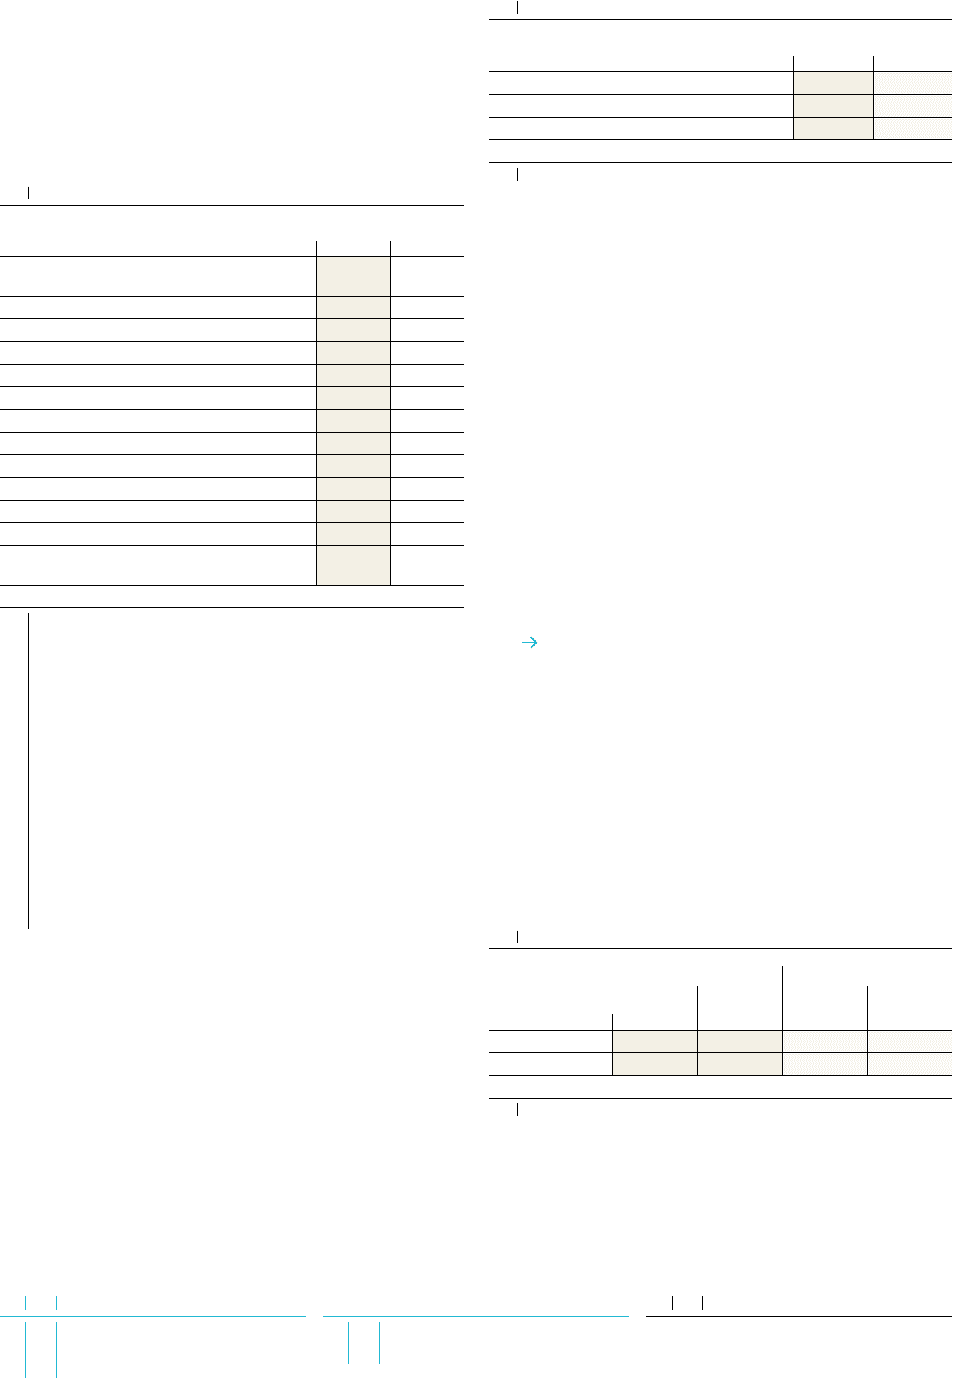
A key factor in maintaining a strong financial profile is our
credit rating which is affected by, among other factors,
Siemens’ capital structure, profitability, ability to generate cash
flows, geographic and product diversification and Siemens’
competitive market position. Siemens’ current corporate credit
ratings from Moody’s Investors Service (Moody’s) and Stan-
dard & Poor’s Ratings Services (S & P) are noted as follows:
September , September ,
Moody’s
Investors
Service
S&P Moody’s
Investors
Service
S&P
Long-term debt Aa3 A + Aa3 A +
Short-term debt P -1 A -1+ P -1 A -1+