Siemens 2014 Annual Report Download - page 210
Download and view the complete annual report
Please find page 210 of the 2014 Siemens annual report below. You can navigate through the pages in the report by either clicking on the pages listed below, or by using the keyword search tool below to find specific information within the annual report.-
 1
1 -
2
-
3
-
4
-
5
-
6
-
7
-
8
-
9
-
10
-
11
-
12
-
13
-
14
-
15
-
16
-
17
-
18
-
19
-
20
-
21
-
22
-
23
-
24
-
25
-
26
-
27
-
28
-
29
-
30
-
31
-
32
-
33
-
34
-
35
-
36
-
37
-
38
-
39
-
40
-
41
-
42
-
43
-
44
-
45
-
46
-
47
-
48
-
49
-
50
-
51
-
52
-
53
-
54
-
55
-
56
-
57
-
58
-
59
-
60
-
61
-
62
-
63
-
64
-
65
-
66
-
67
-
68
-
69
-
70
-
71
-
72
-
73
-
74
-
75
-
76
-
77
-
78
-
79
-
80
-
81
-
82
-
83
-
84
-
85
-
86
-
87
-
88
-
89
-
90
-
91
-
92
-
93
-
94
-
95
-
96
-
97
-
98
-
99
-
100
-
101
-
102
-
103
-
104
-
105
-
106
-
107
-
108
-
109
-
110
-
111
-
112
-
113
-
114
-
115
-
116
-
117
-
118
-
119
-
120
-
121
-
122
-
123
-
124
-
125
-
126
-
127
-
128
-
129
-
130
-
131
-
132
-
133
-
134
-
135
-
136
-
137
-
138
-
139
-
140
-
141
-
142
-
143
-
144
-
145
-
146
-
147
-
148
-
149
-
150
-
151
-
152
-
153
-
154
-
155
-
156
-
157
-
158
-
159
-
160
-
161
-
162
-
163
-
164
-
165
-
166
-
167
-
168
-
169
-
170
-
171
-
172
-
173
-
174
-
175
-
176
-
177
-
178
-
179
-
180
-
181
-
182
-
183
-
184
-
185
-
186
-
187
-
188
-
189
-
190
-
191
-
192
-
193
-
194
-
195
-
196
-
197
-
198
-
199
-
 200
200 -
 201
201 -
 202
202 -
 203
203 -
 204
204 -
 205
205 -
 206
206 -
 207
207 -
 208
208 -
 209
209 -
 210
210 -
 211
211 -
 212
212 -
 213
213 -
 214
214 -
 215
215 -
 216
216 -
 217
217 -
 218
218 -
 219
219 -
 220
220 -
221
-
222
-
223
-
224
-
225
-
226
-
227
-
228
-
229
-
230
-
231
-
232
-
233
-
234
-
235
-
236
-
237
-
238
-
239
-
240
-
241
-
242
-
243
-
244
-
245
-
246
-
247
-
248
-
249
-
250
-
251
-
252
-
253
-
254
-
255
-
256
-
257
-
258
-
259
-
260
-
261
-
262
-
263
-
264
-
265
-
266
-
267
-
268
-
269
-
270
-
271
-
272
-
273
-
274
-
275
-
276
-
277
-
278
-
279
-
280
-
281
-
282
-
283
-
284
-
285
-
286
-
287
-
288
-
289
-
290
-
291
-
292
-
293
-
294
-
295
-
296
-
297
-
298
-
299
-
300
-
301
-
302
-
303
-
304
-
305
-
306
-
307
-
308
-
309
-
310
-
311
-
312
-
313
-
314
-
315
-
316
-
317
-
318
-
319
-
320
-
321
-
322
-
323
-
324
-
325
-
326
-
327
-
328
-
329
-
330
-
331
-
332
-
333
-
334
-
335
-
336
-
337
-
338
-
339
-
340
-
341
-
342
-
343
-
344
-
345
-
346
-
347
-
348
 |
 |
108 A. To our Shareholders 131 B. Corporate Governance 171 C. Combined Management Report
172 C. Business and economic environment
187 C. Financial performance system
193 C. Results of operations
205 C. Financial position
210 C. Net assets position
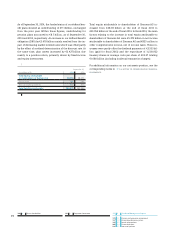
Structure of Consolidated Statements
of Financial Position (in millions of €)
Our total assets in fiscal were influenced by positive cur-
rency translation effects of € . billion, led by the US$. Within
total assets of € . billion, total assets related to SFS
increased to € . billion as of September , from
€ . billion a year earlier. Within total liabilities, SFS debt
increased to € . billion from € . billion a year earlier.
Both changes were driven by planned asset growth at SFS
during fiscal . SFS assets represented % of Siemens’ total
assets as of September , , compared to % a year earlier.
SFS debt represented % of Siemens total liabilities and equity,
compared to % at the end of fiscal .
During fiscal we classified a number of businesses as held
for disposal. These classifications affected a number of line
items in our Consolidated Statements of Financial Position,
which are noted in the discussion below. The relevant busi-
nesses include the following: the Metals Technologies busi-
ness formerly within Industry, the Hospital Information System
business and Microbiology business formerly within Health-
care, and our equity investment stake in BSH.
104,879 101,936
,
(%)
,
(%)
Total assets
3%
,
(%)
Total current
liabilities
,
(%)
Total
non-current
liabilities
,
(%)
Total equity
,
(%)
Sep. ,
Sep. ,
104,879 101,936
Total liabilities
and equity
3%
Sep. ,
Sep. ,
,
(%)
therein:
Total liquidity
8,938
(9%)
Total current
assets
,
(%)
,
(%)
Total
non-current
assets
,
(%)
9,790
(10%)
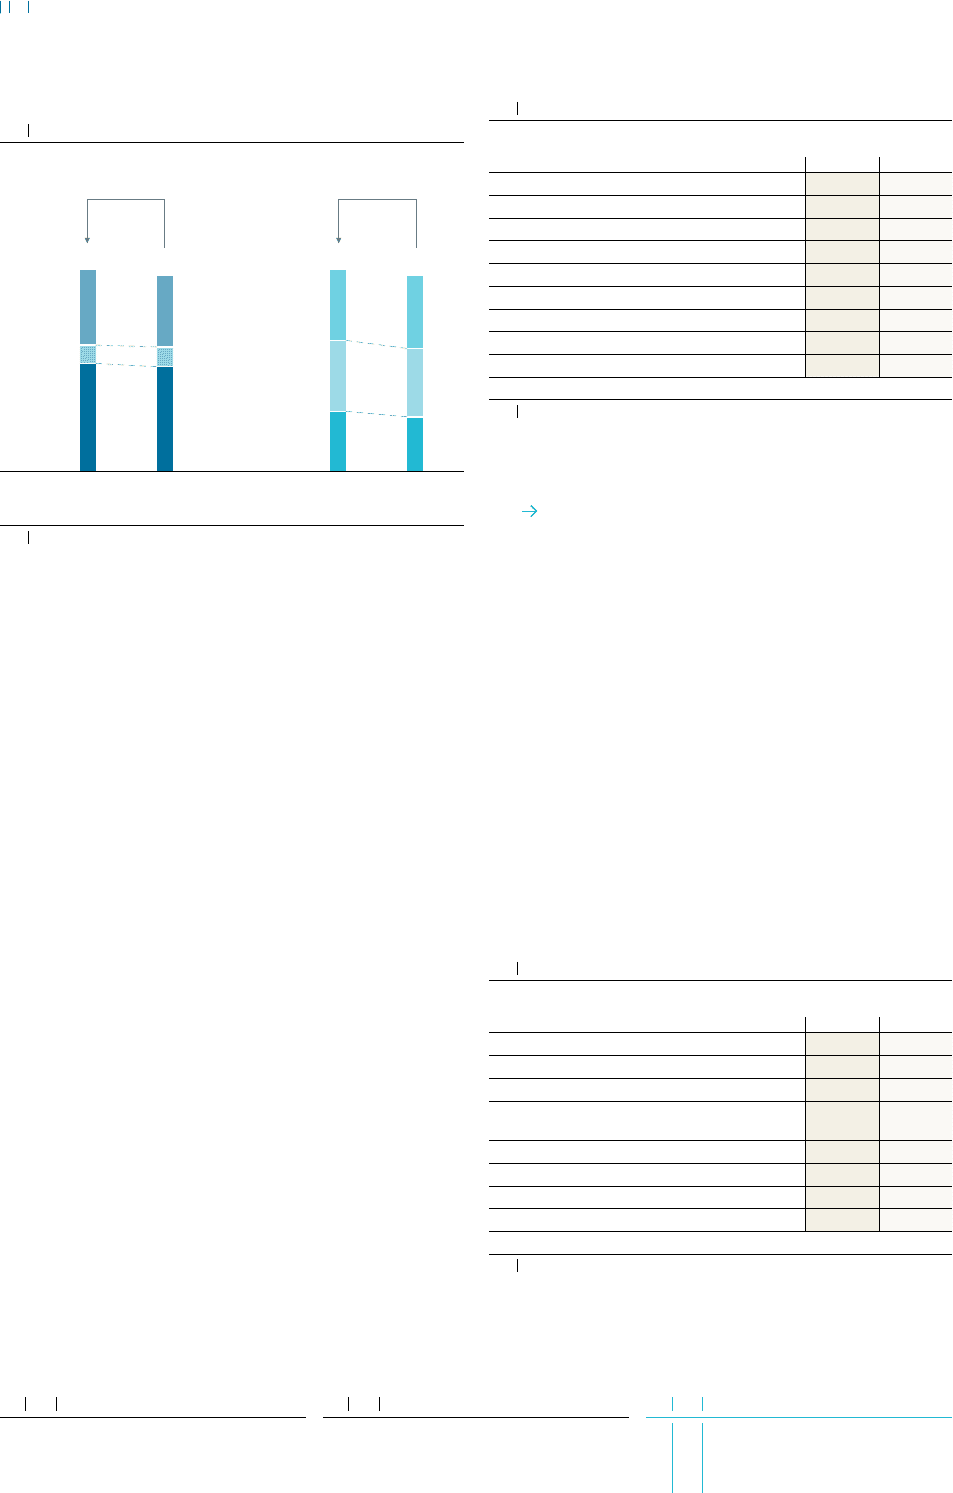
(in millions of €)
September ,
Cash and cash equivalents 8,013 9,190
Available-for-sale financial assets 925 601
Trade and other receivables 14,526 14,853
Other current financial assets 3,710 3,250
Inventories 15,100 15,560
Current income tax assets 577 794
Other current assets 1,290 1,297
Assets classified as held for disposal 3,935 1,393
Total current assets 48,076 46,937
Cash and cash equivalents decreased by € . billion from the
prior-year level. For detailed information regarding the change,
see C.. CASH FLOWS.
The line items Trade and other receivables and Inventories
decreased by € million and € million, respectively, year-
over-year. The main factor in the decreases was assets related
to the Metals Technologies business, which were classified as
held for disposal. These decreases were partly offset by positive
currency translation effects.
The line item Other current financial assets increased by
€ million year-over-year, which included higher loans receiv-
ables of SFS.
Assets classified as held for disposal increased by € . billion
due mainly to the classification of assets related to the Metals
Technologies business, our stake in BSH and the Hospital Infor-
mation System business. This increase was partly offset by a
reduction in assets due to the sale of the Water Technologies
business.
(in millions of €)
September ,
Goodwill 17,783 17,883
Other intangible assets 4,560 5,057
Property, plant and equipment 9,638 9,815
Investments accounted for using
the equity method 2,127 3,022
Other financial assets 18,416 15,117
Deferred tax assets 3,334 3,234
Other assets 945 872
Total non-current assets 56,803 54,999
C. Net assets position