Siemens 2014 Annual Report Download - page 206
Download and view the complete annual report
Please find page 206 of the 2014 Siemens annual report below. You can navigate through the pages in the report by either clicking on the pages listed below, or by using the keyword search tool below to find specific information within the annual report.-
 1
1 -
2
-
3
-
4
-
5
-
6
-
7
-
8
-
9
-
10
-
11
-
12
-
13
-
14
-
15
-
16
-
17
-
18
-
19
-
20
-
21
-
22
-
23
-
24
-
25
-
26
-
27
-
28
-
29
-
30
-
31
-
32
-
33
-
34
-
35
-
36
-
37
-
38
-
39
-
40
-
41
-
42
-
43
-
44
-
45
-
46
-
47
-
48
-
49
-
50
-
51
-
52
-
53
-
54
-
55
-
56
-
57
-
58
-
59
-
60
-
61
-
62
-
63
-
64
-
65
-
66
-
67
-
68
-
69
-
70
-
71
-
72
-
73
-
74
-
75
-
76
-
77
-
78
-
79
-
80
-
81
-
82
-
83
-
84
-
85
-
86
-
87
-
88
-
89
-
90
-
91
-
92
-
93
-
94
-
95
-
96
-
97
-
98
-
99
-
100
-
101
-
102
-
103
-
104
-
105
-
106
-
107
-
108
-
109
-
110
-
111
-
112
-
113
-
114
-
115
-
116
-
117
-
118
-
119
-
120
-
121
-
122
-
123
-
124
-
125
-
126
-
127
-
128
-
129
-
130
-
131
-
132
-
133
-
134
-
135
-
136
-
137
-
138
-
139
-
140
-
141
-
142
-
143
-
144
-
145
-
146
-
147
-
148
-
149
-
150
-
151
-
152
-
153
-
154
-
155
-
156
-
157
-
158
-
159
-
160
-
161
-
162
-
163
-
164
-
165
-
166
-
167
-
168
-
169
-
170
-
171
-
172
-
173
-
174
-
175
-
176
-
177
-
178
-
179
-
180
-
181
-
182
-
183
-
184
-
185
-
186
-
187
-
188
-
189
-
190
-
191
-
192
-
193
-
194
-
195
-
 196
196 -
 197
197 -
 198
198 -
 199
199 -
 200
200 -
 201
201 -
 202
202 -
 203
203 -
 204
204 -
 205
205 -
 206
206 -
 207
207 -
 208
208 -
 209
209 -
 210
210 -
 211
211 -
 212
212 -
 213
213 -
 214
214 -
 215
215 -
 216
216 -
217
-
218
-
219
-
220
-
221
-
222
-
223
-
224
-
225
-
226
-
227
-
228
-
229
-
230
-
231
-
232
-
233
-
234
-
235
-
236
-
237
-
238
-
239
-
240
-
241
-
242
-
243
-
244
-
245
-
246
-
247
-
248
-
249
-
250
-
251
-
252
-
253
-
254
-
255
-
256
-
257
-
258
-
259
-
260
-
261
-
262
-
263
-
264
-
265
-
266
-
267
-
268
-
269
-
270
-
271
-
272
-
273
-
274
-
275
-
276
-
277
-
278
-
279
-
280
-
281
-
282
-
283
-
284
-
285
-
286
-
287
-
288
-
289
-
290
-
291
-
292
-
293
-
294
-
295
-
296
-
297
-
298
-
299
-
300
-
301
-
302
-
303
-
304
-
305
-
306
-
307
-
308
-
309
-
310
-
311
-
312
-
313
-
314
-
315
-
316
-
317
-
318
-
319
-
320
-
321
-
322
-
323
-
324
-
325
-
326
-
327
-
328
-
329
-
330
-
331
-
332
-
333
-
334
-
335
-
336
-
337
-
338
-
339
-
340
-
341
-
342
-
343
-
344
-
345
-
346
-
347
-
348
 |
 |

108 A. To our Shareholders 131 B. Corporate Governance 171 C. Combined Management Report
172 C. Business and economic environment
187 C. Financial performance system
193 C. Results of operations
205 C. Financial position
210 C. Net assets position
over time. In fiscal , the target range for our capital struc-
ture was . – .. The ratio is defined as the item Industrial net
debt divided by the item Adjusted EBITDA. This financial perfor-
mance measure indicates the approximate amount of time in
years that would be needed to cover industrial net debt through
continuing income, without taking into account interest, taxes,
depreciation and amortization.
Our capital structure ratio as of September , decreased
to . from . a year earlier. The change was due to a de-
crease in industrial net debt and an increase in adjusted EBITDA
compared to the prior year. We actively manage this ratio
through our ongoing share buybacks. Our announced acquisi-
tions and divestments of businesses will also have a noticeable
impact on it in fiscal .
For further information on the calculation of adjusted EBITDA
and its changes, see C.. RECONCILIATION TO ADJUSTED EBITDA.
For further information with respect to our capital structure,
the calculation of industrial net debt and its changes, and our
credit rating, see NOTE in D. NOTES TO CONSOLIDATED
FINANCIAL STATEMENTS.
C.. Investing activities
Additions to intangible assets and property, plant and equip-
ment from continuing operations was € . billion in fiscal
, nearly unchanged from the level in the same period a
year earlier. In fiscal , we directed € . billion of these
additions to intangible assets and property, plant and equip-
ment within the Sectors to investments for technological inno-
vations, extending our capacities for designing, manufacturing
and marketing new solutions and for the necessary replace-
ments of fixed assets. The majority of the additions in fiscal
took place in the focus areas of investing activities of the
former Sectors described below, which will basically continue
to be the focus areas regarding the investing activities of the
Industrial Business in fiscal . The remaining portion in fis-
cal , € million, related mainly to SRE and its responsibil-
ity for uniform and comprehensive management of Company
real estate worldwide.
The businesses of the former Energy Sector includes invest-
ments mainly in improving its global footprint to secure com-
petitiveness by improving its cost position and strengthening
technological innovations. These investments include mainly
spending in capacities and facilities related to the business of
the former Power Generation Division, such as new test facili-
ties for highly efficient gas turbines, and for the technology-
driven wind power market, particularly in northern Europe.
Healthcare’s investments are mainly driven by the medical
imaging and therapy systems and laboratory diagnostics busi-
nesses. Large parts of the additions are related to intangible
assets, such as licenses as well as developing and implement-
ing software and IT solutions.
The businesses of the former Industry Sector spend a large por-
tion of its additions to intangible assets, particularly software,
and property, plant and equipment for additional capacities for
innovative products, for optimization of its global footprint;
and for the replacement of fixed assets.
The businesses of the former Infrastructure & Cities Sector
spend large amounts of their additions to intangible assets and
property, plant and equipment for investments in innovations
at the former Power Grid Solutions & Products Business, partic-
ularly including the business activities of the former Low and
Medium Voltage Division, and at the Building Technologies
Division. The businesses also invest significant amounts in the
replacement and expansion of technical equipment in order to
improve productivity and their respective positions in grow-
ing market segments, particularly at the former Transporta-
tion & Logistics Business.
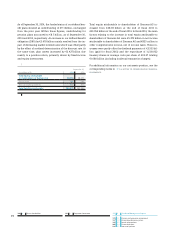
The changes of additions to intangible assets and property,
plant and equipment from fiscal to were as follows:
Additions to intangible assets and property,
plant and equipment (in millions of €)
Siemens (continuing operations)
FY 2014 1,831 1%
FY 2013 1,808
Energy Sector
FY 2014 449 6%
FY 2013 425
Healthcare Sector
FY 2014 303 26%
FY 2013 241
Industry Sector
FY 2014 358 (7)%
FY 2013 384
Infrastructure & Cities Sector
FY 2014 247 3 %
FY 2013 239
For information with respect to acquisitions of businesses, see
C... BUSINESS DESCRIPTION.