Siemens 2014 Annual Report Download - page 244
Download and view the complete annual report
Please find page 244 of the 2014 Siemens annual report below. You can navigate through the pages in the report by either clicking on the pages listed below, or by using the keyword search tool below to find specific information within the annual report.-
 1
1 -
2
-
3
-
4
-
5
-
6
-
7
-
8
-
9
-
10
-
11
-
12
-
13
-
14
-
15
-
16
-
17
-
18
-
19
-
20
-
21
-
22
-
23
-
24
-
25
-
26
-
27
-
28
-
29
-
30
-
31
-
32
-
33
-
34
-
35
-
36
-
37
-
38
-
39
-
40
-
41
-
42
-
43
-
44
-
45
-
46
-
47
-
48
-
49
-
50
-
51
-
52
-
53
-
54
-
55
-
56
-
57
-
58
-
59
-
60
-
61
-
62
-
63
-
64
-
65
-
66
-
67
-
68
-
69
-
70
-
71
-
72
-
73
-
74
-
75
-
76
-
77
-
78
-
79
-
80
-
81
-
82
-
83
-
84
-
85
-
86
-
87
-
88
-
89
-
90
-
91
-
92
-
93
-
94
-
95
-
96
-
97
-
98
-
99
-
100
-
101
-
102
-
103
-
104
-
105
-
106
-
107
-
108
-
109
-
110
-
111
-
112
-
113
-
114
-
115
-
116
-
117
-
118
-
119
-
120
-
121
-
122
-
123
-
124
-
125
-
126
-
127
-
128
-
129
-
130
-
131
-
132
-
133
-
134
-
135
-
136
-
137
-
138
-
139
-
140
-
141
-
142
-
143
-
144
-
145
-
146
-
147
-
148
-
149
-
150
-
151
-
152
-
153
-
154
-
155
-
156
-
157
-
158
-
159
-
160
-
161
-
162
-
163
-
164
-
165
-
166
-
167
-
168
-
169
-
170
-
171
-
172
-
173
-
174
-
175
-
176
-
177
-
178
-
179
-
180
-
181
-
182
-
183
-
184
-
185
-
186
-
187
-
188
-
189
-
190
-
191
-
192
-
193
-
194
-
195
-
196
-
197
-
198
-
199
-
200
-
201
-
202
-
203
-
204
-
205
-
206
-
207
-
208
-
209
-
210
-
211
-
212
-
213
-
214
-
215
-
216
-
217
-
218
-
219
-
220
-
221
-
222
-
223
-
224
-
225
-
226
-
227
-
228
-
229
-
230
-
231
-
232
-
233
-
 234
234 -
 235
235 -
 236
236 -
 237
237 -
 238
238 -
 239
239 -
 240
240 -
 241
241 -
 242
242 -
 243
243 -
 244
244 -
 245
245 -
 246
246 -
 247
247 -
 248
248 -
 249
249 -
 250
250 -
 251
251 -
 252
252 -
 253
253 -
 254
254 -
255
-
256
-
257
-
258
-
259
-
260
-
261
-
262
-
263
-
264
-
265
-
266
-
267
-
268
-
269
-
270
-
271
-
272
-
273
-
274
-
275
-
276
-
277
-
278
-
279
-
280
-
281
-
282
-
283
-
284
-
285
-
286
-
287
-
288
-
289
-
290
-
291
-
292
-
293
-
294
-
295
-
296
-
297
-
298
-
299
-
300
-
301
-
302
-
303
-
304
-
305
-
306
-
307
-
308
-
309
-
310
-
311
-
312
-
313
-
314
-
315
-
316
-
317
-
318
-
319
-
320
-
321
-
322
-
323
-
324
-
325
-
326
-
327
-
328
-
329
-
330
-
331
-
332
-
333
-
334
-
335
-
336
-
337
-
338
-
339
-
340
-
341
-
342
-
343
-
344
-
345
-
346
-
347
-
348
 |
 |

108 A. To our Shareholders 131 B. Corporate Governance 171 C. Combined Management Report
172 C. Business and economic environment
187 C. Financial performance system
193 C. Results of operations
205 C. Financial position
210 C. Net assets position
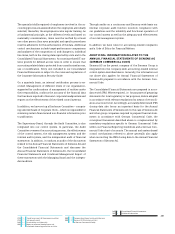
C.. Net assets and financial position
Statement of Financial Position of Siemens AG in
accordance with German Commercial Code (condensed)
September , % Change
(in millions of €)
Assets
Non-current assets
Intangible and tangible assets 2,419 2,437 (1)%
Financial assets 42,121 40,530 4%
44,540 42,967 4%
Current assets
Receivables and other assets 15,816 17,032 (7)%
Cash and cash equivalents,
securities 2,672 2,282 17%
18,488 19,313 (4)%
Prepaid expenses 111 75 48%
Deferred tax assets 2,222 2,467 (10)%
Active difference resulting
from offsetting 40 46 (13)%
Total assets 65,400 64,868 1%
Liabilities and equity
Equity 18,798 18,295 3%
Special reserve with
an equity portion 759 767 (1)%
Provisions
Pensions and similar
commitments 11,103 10,432 6%
Other provisions 7,369 7,827 (6)%
18,472 18,260 1%
Liabilities
Liabilities to banks 208 138 51%
Advanced payments received 677 1,349 (50)%
Trade payables, liabilities
to affiliated companies and
other liabilities 26,189 25,771 2%
27,075 27,257 (1)%
Deferred income 296 290 2%
Total liabilities and equity 65,400 64,868 1%
The increase in Financial assets was due primarily to the pur-
chase of a . % stake in Atos SE from Siemens Beteiligungen
Inland GmbH amounting to € million and a capital increase
of € million relating to Siemens Bank GmbH. In addition,
loans increased € million and securities in non-current
assets came in € million higher. These increases were partly
offset by the sale of our % stake in OSRAM Licht AG to
Siemens Beteiligungen Inland GmbH. The sale price amounted
to € million and the book value amounted to € million.
The decline in Receivables and other assets was due primar-
ily to lower receivables from affiliated companies as a result of
intra-group financing activities.
Cash and cash equivalents and marketable securities
are significantly affected by the liquidity management of
Siemens AG. The liquidity management is based on the finance
strategy of the Siemens Group. Therefore, the change in liquid-
ity of Siemens AG resulted not only from business activities of
Siemens AG.
The increase in Equity was attributable to net income for
the year of € . billion and issuance of treasury stock of
€ million in conjunction with our share-based compensa-
tion program. These factors were partly offset by dividends paid
in fiscal (for fiscal ) of € . billion (for additional
information see C.. DIVIDEND AND SHARE BUYBACKS). In addi-
tion, the equity reduction was due to share buybacks during
the year amounting to € . billion. The equity ratios at Sep-
tember , and were % and %, respectively.
The increase in Pension and similar commitments included
interest and service costs amounting to € . billion and the
effect from the adjustment of the discount rate amounting to
€ million. These factors were partly offset by pension pay-
ments amounting to € million.
The decrease in Other provisions was due primarily to a de-
crease of € million in provisions for personnel expenses and
a decline of € million in provisions for operating expenses.
The increase in Trade payables, liabilities to affiliated com-
panies and other liabilities was due primarily to higher liabil-
ities to affiliated companies as a result of intra-group financing
activities.