Siemens 2014 Annual Report Download - page 207
Download and view the complete annual report
Please find page 207 of the 2014 Siemens annual report below. You can navigate through the pages in the report by either clicking on the pages listed below, or by using the keyword search tool below to find specific information within the annual report.-
 1
1 -
2
-
3
-
4
-
5
-
6
-
7
-
8
-
9
-
10
-
11
-
12
-
13
-
14
-
15
-
16
-
17
-
18
-
19
-
20
-
21
-
22
-
23
-
24
-
25
-
26
-
27
-
28
-
29
-
30
-
31
-
32
-
33
-
34
-
35
-
36
-
37
-
38
-
39
-
40
-
41
-
42
-
43
-
44
-
45
-
46
-
47
-
48
-
49
-
50
-
51
-
52
-
53
-
54
-
55
-
56
-
57
-
58
-
59
-
60
-
61
-
62
-
63
-
64
-
65
-
66
-
67
-
68
-
69
-
70
-
71
-
72
-
73
-
74
-
75
-
76
-
77
-
78
-
79
-
80
-
81
-
82
-
83
-
84
-
85
-
86
-
87
-
88
-
89
-
90
-
91
-
92
-
93
-
94
-
95
-
96
-
97
-
98
-
99
-
100
-
101
-
102
-
103
-
104
-
105
-
106
-
107
-
108
-
109
-
110
-
111
-
112
-
113
-
114
-
115
-
116
-
117
-
118
-
119
-
120
-
121
-
122
-
123
-
124
-
125
-
126
-
127
-
128
-
129
-
130
-
131
-
132
-
133
-
134
-
135
-
136
-
137
-
138
-
139
-
140
-
141
-
142
-
143
-
144
-
145
-
146
-
147
-
148
-
149
-
150
-
151
-
152
-
153
-
154
-
155
-
156
-
157
-
158
-
159
-
160
-
161
-
162
-
163
-
164
-
165
-
166
-
167
-
168
-
169
-
170
-
171
-
172
-
173
-
174
-
175
-
176
-
177
-
178
-
179
-
180
-
181
-
182
-
183
-
184
-
185
-
186
-
187
-
188
-
189
-
190
-
191
-
192
-
193
-
194
-
195
-
196
-
 197
197 -
 198
198 -
 199
199 -
 200
200 -
 201
201 -
 202
202 -
 203
203 -
 204
204 -
 205
205 -
 206
206 -
 207
207 -
 208
208 -
 209
209 -
 210
210 -
 211
211 -
 212
212 -
 213
213 -
 214
214 -
 215
215 -
 216
216 -
 217
217 -
218
-
219
-
220
-
221
-
222
-
223
-
224
-
225
-
226
-
227
-
228
-
229
-
230
-
231
-
232
-
233
-
234
-
235
-
236
-
237
-
238
-
239
-
240
-
241
-
242
-
243
-
244
-
245
-
246
-
247
-
248
-
249
-
250
-
251
-
252
-
253
-
254
-
255
-
256
-
257
-
258
-
259
-
260
-
261
-
262
-
263
-
264
-
265
-
266
-
267
-
268
-
269
-
270
-
271
-
272
-
273
-
274
-
275
-
276
-
277
-
278
-
279
-
280
-
281
-
282
-
283
-
284
-
285
-
286
-
287
-
288
-
289
-
290
-
291
-
292
-
293
-
294
-
295
-
296
-
297
-
298
-
299
-
300
-
301
-
302
-
303
-
304
-
305
-
306
-
307
-
308
-
309
-
310
-
311
-
312
-
313
-
314
-
315
-
316
-
317
-
318
-
319
-
320
-
321
-
322
-
323
-
324
-
325
-
326
-
327
-
328
-
329
-
330
-
331
-
332
-
333
-
334
-
335
-
336
-
337
-
338
-
339
-
340
-
341
-
342
-
343
-
344
-
345
-
346
-
347
-
348
 |
 |

247 D. Consolidated Financial Statements
337 E. Additional Information
213 C. Overall assessment of the economic position
214 C. Subsequent events
215 C. Sustainability and citizenship
225 C. Report on expected developments and
associated material opportunities and risks
242 C. Compensation Report and legal disclosures
242 C. Siemens AG (Discussion on basis
of German Commercial Code)
C.. Cash flows
Cash flows
Continuing operations Discontinued operations Continuing and
discontinued operations
Year ended September , Year ended September , Year ended September ,
(in millions of €)
Cash flows from:
Operating activities 7,230 7,186 (131) 154 7,100 7,340
Investing activities (4,364) (4,759) 339 (317) (4,026) (5,076)
therein: Additions to intangible assets and property,
plant and equipment (1,831) (1,808) (67) (204) (1,898) (2,012)
Free cash flow 5,399 5,378 (198) (50) 5,201 5,328
Financing activities (4,485) (3,715) (2) 319 (4,487) (3,396)
Cash flows from operating activities – Continuing operations
provided cash from operating activities of € . billion in fis-
cal , nearly unchanged from the level a year earlier. In both
periods, the major component of cash inflows was income
from continuing operations, which increased to € . billion
in fiscal from € . billion in the prior year. Included
therein were amortization, depreciation and impairments of
€ . billion in the current period and € . billion in the
prior year. A decrease in operating net working capital led to
cash inflows of € . billion in the current period compared to
outflows of € . billion due to a build-up in operating net work-
ing capital a year earlier. The positive change year-over-year in
operating net working capital related mainly to Energy, in par-
ticular to the Wind Power Division, and to Infrastructure &
Cities’ Transportation & Logistics Business. In fiscal we
recorded negative effects related to changes in other assets and
liabilities, particularly personnel-related liabilities, compared to
positive effects in the prior year. The current period included
cash outflows of approximately € . billion corresponding to
charges to income taken for the “Siemens ” program, com-
pared to € . billion in such outflows in the prior year.
Discontinued operations used cash of € million in fiscal
, compared to cash provided of € million in the prior
year, which included significant cash inflows at OSRAM.
Cash flows from investing activities – Cash used in investing
activities for continuing operations amounted to € . billion
in fiscal , compared to cash used of € . billion in the
prior year. In the current period, cash outflows from investing
activities were due mainly to two factors. Firstly, SFS executed
its planned asset growth during fiscal and we recorded
cash outflows totaling € . billion for a net increase in new
business volume at SFS. Secondly, we had additions to intan-
gible assets and property, plant and equipment of € . bil-
lion, which related mainly to investments within the Sectors.
For comparison, the prior year included cash outflows from the
financing activities at SFS of € . billion and additions to in-
tangible assets and property, plant and equipment of € . bil-
lion. In the prior year, cash outflows for acquisitions of
businesses, net of cash acquired, totaled € . billion. This
total included the preliminary purchase price (excluding cash
acquired) of € . billion related to Infrastructure & Cities’ ac-
quisition of Invensys Rail, and € million related to Indus-
try’s acquisitions of LMS International NV. Also in the prior year
cash inflows from the disposal of investments, intangibles and
property, plant and equipment were € . billion. This total
included proceeds of € . billion relating to the sale of our %
stake in NSN and € . billion relating to the sale of our AtoS
convertible bonds.
Discontinued operations provided cash of € million in fiscal
, compared to cash used of € million in the prior year.
The current period included proceeds (excluding cash sold)
of € . billion related to the sale of the Water Technologies
Business Unit.
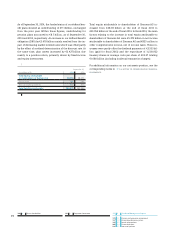
Free cash flow from continuing and discontinued operations
of € . billion in fiscal was near the high level of the
prior year. On a sequential basis, Free cash flow during fiscal
and fiscal developed as follows:
Free cash flow (in millions of €)
Q 3,450
Q 1,048
Q 1,402
Q (699)
Q 4,336
Q 1,053
Q 1,335
Q (1,395)
1 Continuing and discontinued operations.