Sony 2003 Annual Report Download - page 113
Download and view the complete annual report
Please find page 113 of the 2003 Sony annual report below. You can navigate through the pages in the report by either clicking on the pages listed below, or by using the keyword search tool below to find specific information within the annual report.-
 1
1 -
2
-
3
-
4
-
5
-
6
-
7
-
8
-
9
-
10
-
11
-
12
-
13
-
14
-
15
-
16
-
17
-
18
-
19
-
20
-
21
-
22
-
23
-
24
-
25
-
26
-
27
-
28
-
29
-
30
-
31
-
32
-
33
-
34
-
35
-
36
-
37
-
38
-
39
-
40
-
41
-
42
-
43
-
44
-
45
-
46
-
47
-
48
-
49
-
50
-
51
-
52
-
53
-
54
-
55
-
56
-
57
-
58
-
59
-
60
-
61
-
62
-
63
-
64
-
65
-
66
-
67
-
68
-
69
-
70
-
71
-
72
-
73
-
74
-
75
-
76
-
77
-
78
-
79
-
80
-
81
-
82
-
83
-
84
-
85
-
86
-
87
-
88
-
89
-
90
-
91
-
92
-
93
-
94
-
95
-
96
-
97
-
98
-
99
-
100
-
101
-
102
-
 103
103 -
 104
104 -
 105
105 -
 106
106 -
 107
107 -
 108
108 -
 109
109 -
 110
110 -
 111
111 -
 112
112 -
 113
113 -
 114
114 -
 115
115 -
 116
116 -
 117
117 -
 118
118 -
 119
119 -
 120
120 -
 121
121 -
 122
122 -
 123
123 -
124
-
125
-
126
-
127
-
128
-
129
-
130
-
131
-
132
-
133
-
134
-
135
-
136
-
137
-
138
-
139
-
140
-
141
-
142
-
143
-
144
-
145
-
146
-
147
-
148
-
149
-
150
-
151
-
152
-
153
-
154
-
155
-
156
-
157
-
158
-
159
-
160
-
161
-
162
-
163
-
164
-
165
-
166
-
167
-
168
-
169
-
170
-
171
-
172
-
173
-
174
-
175
-
176
-
177
-
178
-
179
-
180
-
181
-
182
-
183
-
184
-
185
-
186
-
187
-
188
-
189
-
190
-
191
-
192
-
193
-
194
-
195
-
196
-
197
-
198
-
199
-
200
-
201
-
202
-
203
-
204
-
205
-
206
-
207
-
208
-
209
-
210
-
211
-
212
-
213
-
214
-
215
-
216
-
217
-
218
-
219
-
220
-
221
-
222
-
223
-
224
-
225
-
226
-
227
-
228
-
229
-
230
-
231
-
232
-
233
 |
 |

Consolidated Financial Information 2003
27
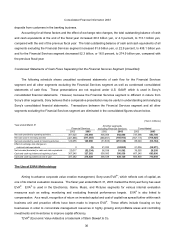
would be exposed to the potential impairment of its investment in the VIE which was 12.8 billion yen at March 31,
2003. Upon Sony’s adoption of FASB’s FIN 46, Sony will begin consolidation of the special purpose entity.
During the fiscal year ended March 31, 1998, Sony established a VIE to implement a stock option plan for
selected Japanese employees. The VIE has been consolidated by Sony since its establishment. Accordingly,
there will be no impact to Sony’s results of operations and financial position upon the adoption of FIN No. 46.
Under the terms of the stock option plan, upon exercise, Japanese employees receive cash equal to the amount
that the market price of Sony Corporation’s common stock exceeds the strike price of the plan. In order to
minimize cash flow exposure associated with the plan, Sony holds treasury stock through the VIE. The VIE
purchased the common stock with funding provided by the employee’s cash contribution and a bank loan which
has been guaranteed by Sony Corporation. If the market value of common stock is below the price that Sony
acquired the treasury stock for at the time of settlement of the stock option plan, Sony is required to reimburse
the VIE for repayment of the bank loan. At March 31, 2003, the balance of the bank loan was 6.9 billion yen.
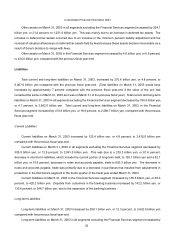
Assets, Liabilities and Stockholders’ Equity
Assets
Total assets on March 31, 2003 increased by 184.8 billion yen, or 2.3 percent, to 8,370.5 billion yen, compared
with the previous fiscal year-end. (Total assets on March 31, 2003 would have increased by approximately 5 percent
compared with the previous fiscal year-end if the value of the yen had remained the same on March 31, 2003 as it
was on March 31, 2002.) Total assets on March 31, 2003 in all segments excluding the Financial Services segment
decreased by 251.1 billion yen, or 4.1 percent, to 5,815.8 billion yen and total assets on March 31, 2003 in the
Financial Services segment increased by 414.4 billion yen, or 16.6 percent, to 2,910.4 billion yen, compared with the
previous fiscal year-end.
Current Assets
Current assets on March 31, 2003 decreased by 183.0 billion yen, or 5.5 percent, to 3,154.2 billion yen
compared with the previous fiscal year-end.
Current assets on March 31, 2003 in all segments excluding the Financial Services segment decreased by
273.2 billion yen, or 9.8 percent, to 2,501.0 billion yen. This decrease was primarily attributable to a 236.5 billion yen,
or 20.1 percent, decrease to 942.2 billion yen in notes and accounts receivable due to a decrease in sales for the
fourth quarter ended March 31, 2003 compared with the same quarter of the previous fiscal year. Inventories on
March 31, 2003 decreased by 47.7 billion yen, or 7.1 percent, to 625.7 billion yen compared with the previous fiscal
year-end. The inventory to cost of sales turn-over ratio (based on the average of inventories at the end of each fiscal
year and previous fiscal year) was 1.57 months, a decrease of 0.28 months from the end of the previous fiscal year.
Inventories in the Electronics segment decreased by 79.6 billion yen, or 15.6 percent, to 432.4 billion yen due to