Sony 2003 Annual Report Download - page 146
Download and view the complete annual report
Please find page 146 of the 2003 Sony annual report below. You can navigate through the pages in the report by either clicking on the pages listed below, or by using the keyword search tool below to find specific information within the annual report.-
 1
1 -
2
-
3
-
4
-
5
-
6
-
7
-
8
-
9
-
10
-
11
-
12
-
13
-
14
-
15
-
16
-
17
-
18
-
19
-
20
-
21
-
22
-
23
-
24
-
25
-
26
-
27
-
28
-
29
-
30
-
31
-
32
-
33
-
34
-
35
-
36
-
37
-
38
-
39
-
40
-
41
-
42
-
43
-
44
-
45
-
46
-
47
-
48
-
49
-
50
-
51
-
52
-
53
-
54
-
55
-
56
-
57
-
58
-
59
-
60
-
61
-
62
-
63
-
64
-
65
-
66
-
67
-
68
-
69
-
70
-
71
-
72
-
73
-
74
-
75
-
76
-
77
-
78
-
79
-
80
-
81
-
82
-
83
-
84
-
85
-
86
-
87
-
88
-
89
-
90
-
91
-
92
-
93
-
94
-
95
-
96
-
97
-
98
-
99
-
100
-
101
-
102
-
103
-
104
-
105
-
106
-
107
-
108
-
109
-
110
-
111
-
112
-
113
-
114
-
115
-
116
-
117
-
118
-
119
-
120
-
121
-
122
-
123
-
124
-
125
-
126
-
127
-
128
-
129
-
130
-
131
-
132
-
133
-
134
-
135
-
 136
136 -
 137
137 -
 138
138 -
 139
139 -
 140
140 -
 141
141 -
 142
142 -
 143
143 -
 144
144 -
 145
145 -
 146
146 -
 147
147 -
 148
148 -
 149
149 -
 150
150 -
 151
151 -
 152
152 -
 153
153 -
 154
154 -
 155
155 -
 156
156 -
157
-
158
-
159
-
160
-
161
-
162
-
163
-
164
-
165
-
166
-
167
-
168
-
169
-
170
-
171
-
172
-
173
-
174
-
175
-
176
-
177
-
178
-
179
-
180
-
181
-
182
-
183
-
184
-
185
-
186
-
187
-
188
-
189
-
190
-
191
-
192
-
193
-
194
-
195
-
196
-
197
-
198
-
199
-
200
-
201
-
202
-
203
-
204
-
205
-
206
-
207
-
208
-
209
-
210
-
211
-
212
-
213
-
214
-
215
-
216
-
217
-
218
-
219
-
220
-
221
-
222
-
223
-
224
-
225
-
226
-
227
-
228
-
229
-
230
-
231
-
232
-
233
 |
 |

Consolidated Financial Information 2003
60
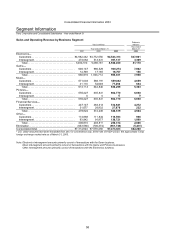
Profit or Loss by Business Segment
Dollars in
Yen in millions millions*
Year ended
Year ended March 31 March 31
2001 2002 2003 2003
Operating income (loss):
Electronics . . . . . . . . . . . . . . . . . . . . . . . . . . . . . . . . . . .¥ 251,146 ¥ (1,158) ¥ 41,380 $ 345
Game . . . . . . . . . . . . . . . . . . . . . . . . . . . . . . . . . . . . . . . . (51,118) 82,915 112,653 939
Music . . . . . . . . . . . . . . . . . . . . . . . . . . . . . . . . . . . . . . . . 20,502 20,175 (8,661) (72)
Pictures. . . . . . . . . . . . . . . . . . . . . . . . . . . . . . . . . . . . . . 4,315 31,266
58,971 491
Financial Services . . . . . . . . . . . . . . . . . . . . . . . . . . . . . 17,432 22,134 23,338 194
Other . . . . . . . . . . . . . . . . . . . . . . . . . . . . . . . . . . . . . . . . (13,715) (16,604) (31,950) (266)
Total . . . . . . . . . . . . . . . . . . . . . . . . . . . . . . . . . . . . . 228,562 138,728
195,731 1,631
Elimination . . . . . . . . . . . . . . . . . . . . . . . . . . . . . . . . . . . 13,781 17,148 15,894 132
Unallocated amounts:
Corporate expenses. . . . . . . . . . . . . . . . . . . . . . . . . . (16,997) (21,245) (26,185) (218)
Consolidated operating income . . . . . . . . . . . . . . . . . . . . . 225,346 134,631 185,440 1,545
Other income . . . . . . . . . . . . . . . . . . . . . . . . . . . . . . . . . . . 167,654 96,328
157,528 1,313
Other expenses. . . . . . . . . . . . . . . . . . . . . . . . . . . . . . . . . . (127,132) (138,184) (95,347) (794)
Consolidated income before income taxes . . . . . . . . . . . ¥ 265,868 ¥ 92,775 ¥ 247,621 $2,064
* U.S. dollar amounts have been translated from yen, for convenience only, at the rate of ¥120=U.S.$1, the approximate
Tokyo foreign exchange market rate as of March 31, 2003.
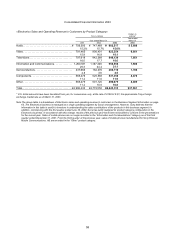
Other Significant Items by Business Segment
Dollars in
Yen in millions millions*
Year ended
Year ended March 31 March 31
2001 2002 2003 2003
Depreciation and amortization:
Electronics . . . . . . . . . . . . . . . . . . . . . . . . . . . . . . . . . . .¥ 209,616 ¥ 211,910 ¥ 190,836 $1,590
Game . . . . . . . . . . . . . . . . . . . . . . . . . . . . . . . . . . . . . . . . 37,497 49,655 53,496 446
Music . . . . . . . . . . . . . . . . . . . . . . . . . . . . . . . . . . . . . . . . 34,648 34,835 33,650 280
Pictures. . . . . . . . . . . . . . . . . . . . . . . . . . . . . . . . . . . . . . 11,853 10,619 8,552 71
Financial Services, including
deferred insurance acquisition costs . . . . . . . . . . . . 44,995 37,227 52,041 434
Other . . . . . . . . . . . . . . . . . . . . . . . . . . . . . . . . . . . . . . . . 6,184 6,568 9,112 76
Total . . . . . . . . . . . . . . . . . . . . . . . . . . . . . . . . . . . . . 344,793 350,814 347,687 2,897
Corporate. . . . . . . . . . . . . . . . . . . . . . . . . . . . . . . . . . . . . 3,475 3,321 4,238 36
Consolidated total . . . . . . . . . . . . . . . . . . . . . . . . . . . . . . . .¥ 348,268 ¥ 354,135 ¥ 351,925 $2,933
Capital expenditures for segment assets:
Electronics . . . . . . . . . . . . . . . . . . . . . . . . . . . . . . . . . . .¥ 281,660 ¥ 220,032 ¥ 170,323 $1,419
Game . . . . . . . . . . . . . . . . . . . . . . . . . . . . . . . . . . . . . . . . 108,168 47,822 40,986 342
Music . . . . . . . . . . . . . . . . . . . . . . . . . . . . . . . . . . . . . . . . 37,776 21,535 21,875 182
Pictures. . . . . . . . . . . . . . . . . . . . . . . . . . . . . . . . . . . . . . 11,020 11,501 7,138 60
Financial Services . . . . . . . . . . . . . . . . . . . . . . . . . . . . . 9,341 16,023 3,655 30
Other . . . . . . . . . . . . . . . . . . . . . . . . . . . . . . . . . . . . . . . . 13,538 5,208 15,402 128
Total . . . . . . . . . . . . . . . . . . . . . . . . . . . . . . . . . . . . . 461,503 322,121 259,379 2,161
Corporate. . . . . . . . . . . . . . . . . . . . . . . . . . . . . . . . . . . . . 3,706 4,613 1,862 16
Consolidated total . . . . . . . . . . . . . . . . . . . . . . . . . . . . . . . .¥ 465,209 ¥ 326,734 ¥ 261,241 $2,177
* U.S. dollar amounts have been translated from yen, for convenience only, at the rate of ¥120=U.S.$1, the approximate
Tokyo foreign exchange market rate as of March 31, 2003.