Sony 2003 Annual Report Download - page 120
Download and view the complete annual report
Please find page 120 of the 2003 Sony annual report below. You can navigate through the pages in the report by either clicking on the pages listed below, or by using the keyword search tool below to find specific information within the annual report.-
 1
1 -
2
-
3
-
4
-
5
-
6
-
7
-
8
-
9
-
10
-
11
-
12
-
13
-
14
-
15
-
16
-
17
-
18
-
19
-
20
-
21
-
22
-
23
-
24
-
25
-
26
-
27
-
28
-
29
-
30
-
31
-
32
-
33
-
34
-
35
-
36
-
37
-
38
-
39
-
40
-
41
-
42
-
43
-
44
-
45
-
46
-
47
-
48
-
49
-
50
-
51
-
52
-
53
-
54
-
55
-
56
-
57
-
58
-
59
-
60
-
61
-
62
-
63
-
64
-
65
-
66
-
67
-
68
-
69
-
70
-
71
-
72
-
73
-
74
-
75
-
76
-
77
-
78
-
79
-
80
-
81
-
82
-
83
-
84
-
85
-
86
-
87
-
88
-
89
-
90
-
91
-
92
-
93
-
94
-
95
-
96
-
97
-
98
-
99
-
100
-
101
-
102
-
103
-
104
-
105
-
106
-
107
-
108
-
109
-
 110
110 -
 111
111 -
 112
112 -
 113
113 -
 114
114 -
 115
115 -
 116
116 -
 117
117 -
 118
118 -
 119
119 -
 120
120 -
 121
121 -
 122
122 -
 123
123 -
 124
124 -
 125
125 -
 126
126 -
 127
127 -
 128
128 -
 129
129 -
 130
130 -
131
-
132
-
133
-
134
-
135
-
136
-
137
-
138
-
139
-
140
-
141
-
142
-
143
-
144
-
145
-
146
-
147
-
148
-
149
-
150
-
151
-
152
-
153
-
154
-
155
-
156
-
157
-
158
-
159
-
160
-
161
-
162
-
163
-
164
-
165
-
166
-
167
-
168
-
169
-
170
-
171
-
172
-
173
-
174
-
175
-
176
-
177
-
178
-
179
-
180
-
181
-
182
-
183
-
184
-
185
-
186
-
187
-
188
-
189
-
190
-
191
-
192
-
193
-
194
-
195
-
196
-
197
-
198
-
199
-
200
-
201
-
202
-
203
-
204
-
205
-
206
-
207
-
208
-
209
-
210
-
211
-
212
-
213
-
214
-
215
-
216
-
217
-
218
-
219
-
220
-
221
-
222
-
223
-
224
-
225
-
226
-
227
-
228
-
229
-
230
-
231
-
232
-
233
 |
 |

Consolidated Financial Information 2003
34
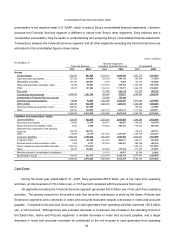
presentation is not required under U.S. GAAP, which is used in Sony’s consolidated financial statements. However,
because the Financial Services segment is different in nature from Sony’s other segments, Sony believes that a
comparative presentation may be useful in understanding and analyzing Sony’s consolidated financial statements.
Transactions between the Financial Services segment and all other segments excluding the Financial Services are
eliminated in the consolidated figures shown below.
(Yen in millions)
As at March 31
Financial Services
All other Segments
excluding Financial Services Consolidated
2002 2003 2002 2003 2002 2003
Assets
Current assets . . . . . . . . . . . . . . . . . . . . . . . . . 626,676 687,925 2,774,121 2,500,959 3,337,212 3,154,214
Cash and cash equivalents . . . . . . . . . . . . . . . . . 327,262 274,928 356,538 438,130 683,800 713,058
Marketable securities . . . . . . . . . . . . . . . . . . . 157,363 236,621 4,784 4,899 162,147 241,520
Notes and accounts receivable, trade . . . . . . . 76,530 69,067 1,178,675 942,193 1,242,826 1,007,395
Other . . . . . . . . . . . . . . . . . . . . . . . . . . . . . . . 65,521 107,309 1,234,124 1,115,737 1,248,439 1,192,241
Film costs . . . . . . . . . . . . . . . . . . . . . . . . . . . . - -313,054 287,778 313,054 287,778
Investments and advances . . . . . . . . . . . . . . . . 1,388,556 1,741,748 420,226 372,671 1,697,807 1,994,123
Investments in Financial Services, at cost . . . . - -170,189 170,189 - -
Property, plant and equipment . . . . . . . . . . . . . . 50,084 45,993 1,361,582 1,232,357 1,411,666 1,278,350
Other assets . . . . . . . . . . . . . . . . . . . . . . . . . . . 430,736 434,768 1,027,716 1,251,811 1,426,056 1,656,080
Deferred insurance acquisition costs . . . . . . . . . 308,204 327,869 --308,204 327,869
Other . . . . . . . . . . . . . . . . . . . . . . . . . . . . . . . 122,532 106,899 1,027,716 1,251,811 1,117,852 1,328,211
2,496,052 2,910,434 6,066,888 5,815,765 8,185,795 8,370,545
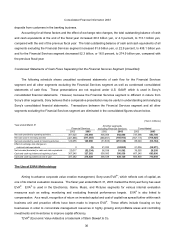
Liabilities and stockholders’ equity
Current liabilities . . . . . . . . . . . . . . . . . . . . . . . 254,740 420,246 2,367,341 2,061,485 2,558,496 2,435,048
Short-term borrowings . . . . . . . . . . . . . . . . . . . 66,886 72,753 329,977 126,687 354,063 158,745
Notes and accounts payable, trade . . . . . . . . 4,552 5,658 775,452 693,347 767,625 697,385
Deposits from customers in the banking
business 106,472 248,721 --106,472 248,721
Other . . . . . . . . . . . . . . . . . . . . . . . . . . . . . . . . 76,830 93,114 1,261,912 1,241,451 1,330,336 1,330,197
Long-term liabilities . . . . . . . . . . . . . . . . . . . . . 1,923,126 2,168,476 1,451,033 1,600,484 3,233,521 3,632,580
Long-term debt . . . . . . . . . . . . . . . . . . . . . . . . 135,958 140,908 813,487 802,911 838,617 807,439
Accrued pension and severance costs . . . . . . 7,469 8,737 291,620 487,437 299,089 496,174
Future insurance policy benefits and other . . . . 1,680,418 1,914,410 --1,680,418 1,914,410
Other . . . . . . . . . . . . . . . . . . . . . . . . . . . . . . . .. 99,281 104,421 345,926 310,136 415,397 414,557
Minority interest in consolidated subsidiaries . . - -16,170 15,677 23,368 22,022
Stockholders’ equity . . . . . . . . . . . . . . . . . . . . 318,186 321,712 2,232,344 2,138,119 2,370,410 2,280,895
2,496,052 2,910,434 6,066,888 5,815,765 8,185,795 8,370,545
Cash Flows
During the fiscal year ended March 31, 2003, Sony generated 853.8 billion yen of net cash from operating
activities, an improvement of 116.2 billion yen, or 15.8 percent compared with the previous fiscal year.
All segments excluding the Financial Services segment generated 542.8 billion yen of net cash from operating
activities. The primary reasons for the positive cash flow were the contribution to profit by the Game, Pictures and
Electronics segments and a decrease in notes and accounts receivable despite a decrease in notes and accounts
payable. Compared to the previous fiscal year, net cash generated from operating activities improved 106.8 billion
yen, or 24.5 percent. Although there was a smaller decrease in inventories, the increase in the operating income in
the Electronics, Game and Pictures segments, a smaller decrease in notes and accounts payable, and a larger
decrease in notes and accounts receivable all contributed to the net increase in cash generated from operating