Sony 2003 Annual Report Download - page 121
Download and view the complete annual report
Please find page 121 of the 2003 Sony annual report below. You can navigate through the pages in the report by either clicking on the pages listed below, or by using the keyword search tool below to find specific information within the annual report.-
 1
1 -
2
-
3
-
4
-
5
-
6
-
7
-
8
-
9
-
10
-
11
-
12
-
13
-
14
-
15
-
16
-
17
-
18
-
19
-
20
-
21
-
22
-
23
-
24
-
25
-
26
-
27
-
28
-
29
-
30
-
31
-
32
-
33
-
34
-
35
-
36
-
37
-
38
-
39
-
40
-
41
-
42
-
43
-
44
-
45
-
46
-
47
-
48
-
49
-
50
-
51
-
52
-
53
-
54
-
55
-
56
-
57
-
58
-
59
-
60
-
61
-
62
-
63
-
64
-
65
-
66
-
67
-
68
-
69
-
70
-
71
-
72
-
73
-
74
-
75
-
76
-
77
-
78
-
79
-
80
-
81
-
82
-
83
-
84
-
85
-
86
-
87
-
88
-
89
-
90
-
91
-
92
-
93
-
94
-
95
-
96
-
97
-
98
-
99
-
100
-
101
-
102
-
103
-
104
-
105
-
106
-
107
-
108
-
109
-
110
-
 111
111 -
 112
112 -
 113
113 -
 114
114 -
 115
115 -
 116
116 -
 117
117 -
 118
118 -
 119
119 -
 120
120 -
 121
121 -
 122
122 -
 123
123 -
 124
124 -
 125
125 -
 126
126 -
 127
127 -
 128
128 -
 129
129 -
 130
130 -
 131
131 -
132
-
133
-
134
-
135
-
136
-
137
-
138
-
139
-
140
-
141
-
142
-
143
-
144
-
145
-
146
-
147
-
148
-
149
-
150
-
151
-
152
-
153
-
154
-
155
-
156
-
157
-
158
-
159
-
160
-
161
-
162
-
163
-
164
-
165
-
166
-
167
-
168
-
169
-
170
-
171
-
172
-
173
-
174
-
175
-
176
-
177
-
178
-
179
-
180
-
181
-
182
-
183
-
184
-
185
-
186
-
187
-
188
-
189
-
190
-
191
-
192
-
193
-
194
-
195
-
196
-
197
-
198
-
199
-
200
-
201
-
202
-
203
-
204
-
205
-
206
-
207
-
208
-
209
-
210
-
211
-
212
-
213
-
214
-
215
-
216
-
217
-
218
-
219
-
220
-
221
-
222
-
223
-
224
-
225
-
226
-
227
-
228
-
229
-
230
-
231
-
232
-
233
 |
 |
Consolidated Financial Information 2003
35
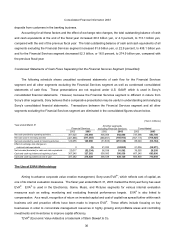
activities compared with the previous fiscal year.
The Financial Services segment generated 316.0 billion yen of net cash from operating activities. While cash
declined primarily as a result of an increase in deferred insurance acquisition costs, an increase in future insurance
policy benefits and other as a result of an increase in insurance-in-force resulted in cash generated from operating
activities exceeding expenditures. Compared with the previous fiscal year, cash generated from operating activities
in the Financial Services segment improved by 14.3 billion yen, or 4.8 percent.
During the fiscal year, 706.4 billion yen in cash was used in investing activities (a decrease of 60.7 billion yen, or
7.9 percent compared with the previous fiscal year).
In all segments excluding the Financial Services segment, 185.2 billion yen in cash was used in investing
activities. During the fiscal year, cash was used to purchase fixed assets mainly in the Electronics segment. Cash
proceeds of 135.8 billion yen were generated from sales of securities investments, maturities of marketable securities
and collections of advances, including 88.4 billion yen from the sale of Telemundo. Compared with the previous fiscal
year, cash used in investing activities decreased by 183.8 billion yen, or 49.8 percent. As a result of a reduction in
capital expenditures mainly in the Electronics segment, cash used to purchase fixed assets decreased compared
with the previous fiscal year.
In the Financial Services segment, 517.4 billion yen in cash was used in investing activities (an increase of
115.5 billion yen, or 28.7 percent compared with the previous fiscal year). The use of cash derived primarily from the
fact that investments and advances of 1,026.4 billion yen exceeded sales of securities investments, maturities of
marketable securities and collections of advances of 542.5 billion yen, reflecting an increase in assets under
management in the Financial Services segment.
As a result of these factors, net cash flow (the difference between cash generated from operating activities and
cash used in investing activities) was a positive 147.4 billion yen for the fiscal year, an improvement of 176.9 billion
yen compared with the previous fiscal year (in the previous fiscal year, net cash flow was a negative 29.5 billion yen).
In terms of net cash flow from all segments excluding the Financial Services segment, net cash flow was a positive
357.7 billion yen for the fiscal year, an improvement of 290.6 billon yen, or 433.0 percent, compared with the previous
fiscal year. Net cash flow from the Financial Services segment was a negative 201.4 billion yen, a deterioration of
101.2 billion yen compared with the previous fiscal year.
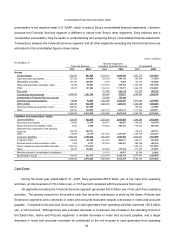
During the fiscal year ended March 31, 2003, 93.1 billion yen of net cash was used in financing activities
compared to 85.0 billion yen of cash provided by financing activities. 22.9 billion yen in cash was used for the
payment of dividends.
In all segments excluding the Financial Services segment, 251.1 billion yen of net cash was used in financing
activities compared to 31.6 billion yen of cash used in financing activities. Cash was used during the fiscal year for
repayments of long-term debt including 1.5 billion U.S. dollars of U.S. dollar notes redeemed on March 4, 2003.
These repayments caused cash used in financing activities to exceed cash generated by financing activities.
In the Financial Services segment, 149.1 billion yen of net cash was provided by financing activities compared
to 120.3 billion yen provided by financing activities. This was due to a 142.2 billion yen, or 133.6 percent, increase in