Sony 2003 Annual Report Download - page 180
Download and view the complete annual report
Please find page 180 of the 2003 Sony annual report below. You can navigate through the pages in the report by either clicking on the pages listed below, or by using the keyword search tool below to find specific information within the annual report.-
 1
1 -
2
-
3
-
4
-
5
-
6
-
7
-
8
-
9
-
10
-
11
-
12
-
13
-
14
-
15
-
16
-
17
-
18
-
19
-
20
-
21
-
22
-
23
-
24
-
25
-
26
-
27
-
28
-
29
-
30
-
31
-
32
-
33
-
34
-
35
-
36
-
37
-
38
-
39
-
40
-
41
-
42
-
43
-
44
-
45
-
46
-
47
-
48
-
49
-
50
-
51
-
52
-
53
-
54
-
55
-
56
-
57
-
58
-
59
-
60
-
61
-
62
-
63
-
64
-
65
-
66
-
67
-
68
-
69
-
70
-
71
-
72
-
73
-
74
-
75
-
76
-
77
-
78
-
79
-
80
-
81
-
82
-
83
-
84
-
85
-
86
-
87
-
88
-
89
-
90
-
91
-
92
-
93
-
94
-
95
-
96
-
97
-
98
-
99
-
100
-
101
-
102
-
103
-
104
-
105
-
106
-
107
-
108
-
109
-
110
-
111
-
112
-
113
-
114
-
115
-
116
-
117
-
118
-
119
-
120
-
121
-
122
-
123
-
124
-
125
-
126
-
127
-
128
-
129
-
130
-
131
-
132
-
133
-
134
-
135
-
136
-
137
-
138
-
139
-
140
-
141
-
142
-
143
-
144
-
145
-
146
-
147
-
148
-
149
-
150
-
151
-
152
-
153
-
154
-
155
-
156
-
157
-
158
-
159
-
160
-
161
-
162
-
163
-
164
-
165
-
166
-
167
-
168
-
169
-
 170
170 -
 171
171 -
 172
172 -
 173
173 -
 174
174 -
 175
175 -
 176
176 -
 177
177 -
 178
178 -
 179
179 -
 180
180 -
 181
181 -
 182
182 -
 183
183 -
 184
184 -
 185
185 -
 186
186 -
 187
187 -
 188
188 -
 189
189 -
 190
190 -
191
-
192
-
193
-
194
-
195
-
196
-
197
-
198
-
199
-
200
-
201
-
202
-
203
-
204
-
205
-
206
-
207
-
208
-
209
-
210
-
211
-
212
-
213
-
214
-
215
-
216
-
217
-
218
-
219
-
220
-
221
-
222
-
223
-
224
-
225
-
226
-
227
-
228
-
229
-
230
-
231
-
232
-
233
 |
 |

Consolidated Financial Information 2003
- 94 -
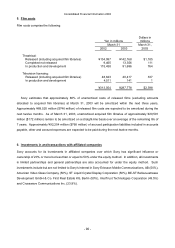
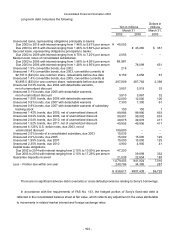
8. Marketable securities and securities investments and other
Marketable securities and securities investments and other include debt and equity securities of which the
aggregate cost, gross unrealized gains and losses and fair value pertaining to available-for-sale securities and
held-to-maturity securities are as follows:
Yen in millions
March 31, 2002 March 31, 2003
Cost
Gross
unrealized
gains
Gross
unrealized
losses Fair value Cost
Gross
unrealized
gains
Gross
unrealized
losses Fair value
Available-for-sale:
Debt securities ¥1,150,630 ¥41,241 ¥15,930 ¥1,175,941 ¥1,550,290 ¥37,237
¥
8,430 ¥1,579,097
Equity securities 58,374 30,371 7,829 80,916 63,786 8,222 4,330 67,678
Held-to-maturity
securities 19,835 353 9 20,179 18,153 672 1 18,824
Total ¥1,228,839 ¥71,965 ¥23,768 ¥1,277,036 ¥1,632,229
¥
46,131 ¥12,761 ¥1,665,599
Dollars in millions
March 31, 2003
Cost
Gross
unrealized
gains
Gross
unrealized
losses Fair value
Available-for-sale:
Debt securities $12,919 $310 $70 $13,159
Equity securities 532 68 36 564
Held-to-maturity
securities 151 6 0 157
Total $13,602 $384 $106 $13,880
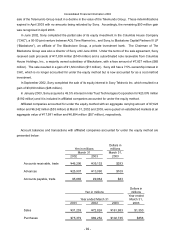
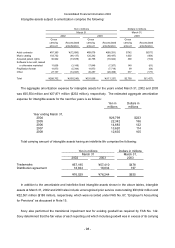
At March 31, 2003, debt securities classified as available-for-sale securities and held-to-maturity securities
mainly consist of Japanese government and municipal bonds and corporate debt securities due within 1 to 10
years.
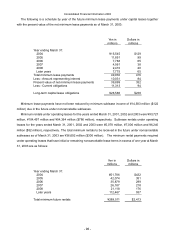
Proceeds from sales of available-for-sale securities were ¥91,424 million, ¥193,048 million and ¥215,554
million ($1,796 million) for the years ended March 31, 2001, 2002 and 2003, respectively. On those sales,
gross realized gains computed on the average cost basis were ¥5,291 million, ¥6,397 million and ¥3,570
million ($30 million) and gross realized losses were ¥416 million, ¥3,803 million and ¥3,125 million ($26 million),
respectively.
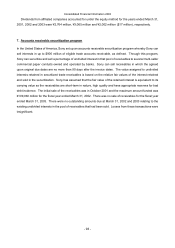
In March 2001, Sony Corporation and consolidated subsidiaries contributed certain marketable equity
securities, not including those of its subsidiaries and affiliated companies, to an employee retirement benefit
trust, with no cash proceeds thereon. The fair value of these securities at the time of contribution was ¥14,316
million.