Sony 2003 Annual Report Download - page 133
Download and view the complete annual report
Please find page 133 of the 2003 Sony annual report below. You can navigate through the pages in the report by either clicking on the pages listed below, or by using the keyword search tool below to find specific information within the annual report.-
 1
1 -
2
-
3
-
4
-
5
-
6
-
7
-
8
-
9
-
10
-
11
-
12
-
13
-
14
-
15
-
16
-
17
-
18
-
19
-
20
-
21
-
22
-
23
-
24
-
25
-
26
-
27
-
28
-
29
-
30
-
31
-
32
-
33
-
34
-
35
-
36
-
37
-
38
-
39
-
40
-
41
-
42
-
43
-
44
-
45
-
46
-
47
-
48
-
49
-
50
-
51
-
52
-
53
-
54
-
55
-
56
-
57
-
58
-
59
-
60
-
61
-
62
-
63
-
64
-
65
-
66
-
67
-
68
-
69
-
70
-
71
-
72
-
73
-
74
-
75
-
76
-
77
-
78
-
79
-
80
-
81
-
82
-
83
-
84
-
85
-
86
-
87
-
88
-
89
-
90
-
91
-
92
-
93
-
94
-
95
-
96
-
97
-
98
-
99
-
100
-
101
-
102
-
103
-
104
-
105
-
106
-
107
-
108
-
109
-
110
-
111
-
112
-
113
-
114
-
115
-
116
-
117
-
118
-
119
-
120
-
121
-
122
-
 123
123 -
 124
124 -
 125
125 -
 126
126 -
 127
127 -
 128
128 -
 129
129 -
 130
130 -
 131
131 -
 132
132 -
 133
133 -
 134
134 -
 135
135 -
 136
136 -
 137
137 -
 138
138 -
 139
139 -
 140
140 -
 141
141 -
 142
142 -
 143
143 -
144
-
145
-
146
-
147
-
148
-
149
-
150
-
151
-
152
-
153
-
154
-
155
-
156
-
157
-
158
-
159
-
160
-
161
-
162
-
163
-
164
-
165
-
166
-
167
-
168
-
169
-
170
-
171
-
172
-
173
-
174
-
175
-
176
-
177
-
178
-
179
-
180
-
181
-
182
-
183
-
184
-
185
-
186
-
187
-
188
-
189
-
190
-
191
-
192
-
193
-
194
-
195
-
196
-
197
-
198
-
199
-
200
-
201
-
202
-
203
-
204
-
205
-
206
-
207
-
208
-
209
-
210
-
211
-
212
-
213
-
214
-
215
-
216
-
217
-
218
-
219
-
220
-
221
-
222
-
223
-
224
-
225
-
226
-
227
-
228
-
229
-
230
-
231
-
232
-
233
 |
 |

Consolidated Financial Information 2003
47
individually with total assets and pension obligation amounting to less than 10% of those of the Japanese plans.
Sony used a discount rate of 1.9% for its Japanese pension plan as of March 31, 2003. The discount rate was
determined by using available information about rates of return on high-quality fixed-income investments currently
available and expected to be available during the period to maturity of the pension benefit. The 1.9% discount rate
represents a 50 basis point reduction from the 2.4% discount rate used for the fiscal year ended March 31, 2002 and
reflects market interest rate conditions. For Japanese plans, a 50 basis point decrease in the discount rate would
increase pension expenses by approximately 12.0 billion yen, compared to the year ended March 31, 2003.
To determine the expected long-term rate of return on pension plan assets, Sony considers the current and
expected asset allocations, as well as historical and expected long-term rate of returns on various categories of plan
assets. For Japanese pension plans, the expected long-term rate of return on pension plan assets was 4.0% as of
March 31, 2002 and March 31, 2003. The actual return on pension plan assets for the year ending March 31, 2003
was a negative return of 14.6%. Consistent with U.S. GAAP, actual results that differ from the expected return on
plan assets are accumulated and amortized as a component of pension expense over the average future service
period, thereby reducing the year-to-year volatility in pension expense. At March 31, 2002 and 2003, Sony had
unrecognized actuarial losses of 325.6 billion yen and 513.0 billion yen, respectively, including losses related to plan
assets. The unrecognized actuarial losses reflect the unfavorable performance of equity markets over the past two
years and will result in an increase in pension expense as they are recognized.
Sony recorded a liability for the unfunded accumulated benefit obligation for Japanese pension plans of 148.0
billion yen and 308.7 billion yen as of March 31, 2002 and 2003, respectively. This liability represents the excess of
the accumulated benefit obligation under Sony’s qualified defined benefit pension plans over the fair value of the
plans’ assets. In accordance with U.S. GAAP, this liability was established by a charge to stockholders’ equity,
resulting in no impact to the accompanying consolidated statement of income.
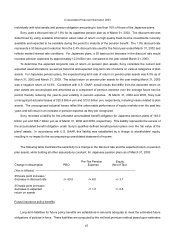
The following table illustrates the sensitivity to a change in the discount rate and the expected return on pension
plan assets, while holding all other assumptions constant, for Japanese pension plans as of March 31, 2003:
Pre-Tax Pension Equity
Change in Assumption PBO Expense (Net of Tax)
(Yen in billions) --------------------------------------------------------------------------------------------------------
25 basis point increase /
decrease in discount rate -/+ 50.0 -/+ 6.0 +/- 3.1
25 basis point increase /
decrease in expected - -/+ 1.0 +/- 0.6
return on assets
Future insurance policy benefits
Long-term liabilities for future policy benefits are established in amounts adequate to meet the estimated future
obligations of policies in force. These liabilities are computed by the net level premium method based upon estimates