Sony 2003 Annual Report Download - page 75
Download and view the complete annual report
Please find page 75 of the 2003 Sony annual report below. You can navigate through the pages in the report by either clicking on the pages listed below, or by using the keyword search tool below to find specific information within the annual report.-
 1
1 -
2
-
3
-
4
-
5
-
6
-
7
-
8
-
9
-
10
-
11
-
12
-
13
-
14
-
15
-
16
-
17
-
18
-
19
-
20
-
21
-
22
-
23
-
24
-
25
-
26
-
27
-
28
-
29
-
30
-
31
-
32
-
33
-
34
-
35
-
36
-
37
-
38
-
39
-
40
-
41
-
42
-
43
-
44
-
45
-
46
-
47
-
48
-
49
-
50
-
51
-
52
-
53
-
54
-
55
-
56
-
57
-
58
-
59
-
60
-
61
-
62
-
63
-
64
-
 65
65 -
 66
66 -
 67
67 -
 68
68 -
 69
69 -
 70
70 -
 71
71 -
 72
72 -
 73
73 -
 74
74 -
 75
75 -
 76
76 -
 77
77 -
 78
78 -
 79
79 -
 80
80 -
 81
81 -
 82
82 -
 83
83 -
 84
84 -
 85
85 -
86
-
87
-
88
-
89
-
90
-
91
-
92
-
93
-
94
-
95
-
96
-
97
-
98
-
99
-
100
-
101
-
102
-
103
-
104
-
105
-
106
-
107
-
108
-
109
-
110
-
111
-
112
-
113
-
114
-
115
-
116
-
117
-
118
-
119
-
120
-
121
-
122
-
123
-
124
-
125
-
126
-
127
-
128
-
129
-
130
-
131
-
132
-
133
-
134
-
135
-
136
-
137
-
138
-
139
-
140
-
141
-
142
-
143
-
144
-
145
-
146
-
147
-
148
-
149
-
150
-
151
-
152
-
153
-
154
-
155
-
156
-
157
-
158
-
159
-
160
-
161
-
162
-
163
-
164
-
165
-
166
-
167
-
168
-
169
-
170
-
171
-
172
-
173
-
174
-
175
-
176
-
177
-
178
-
179
-
180
-
181
-
182
-
183
-
184
-
185
-
186
-
187
-
188
-
189
-
190
-
191
-
192
-
193
-
194
-
195
-
196
-
197
-
198
-
199
-
200
-
201
-
202
-
203
-
204
-
205
-
206
-
207
-
208
-
209
-
210
-
211
-
212
-
213
-
214
-
215
-
216
-
217
-
218
-
219
-
220
-
221
-
222
-
223
-
224
-
225
-
226
-
227
-
228
-
229
-
230
-
231
-
232
-
233
 |
 |

Sony Corporation Annual Report 2003 73
200
100
0
0
5,000
10,000
15,000
20,000
25,000
2001
2002
2003
39.6%
38.7%
35.8%
29.4%
28.2%
27.0%
23.5%
27.4%
30.5%
6.0%
5.2%
5.6%
1.5%
0.5%
1.1%
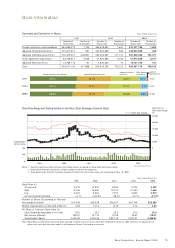
Stock Information
Stock Price Range and Trading Volume on the Tokyo Stock Exchange (Common Stock)
Notes: 1. M onthly stock prices (high and low ) and trading volume are based on Tokyo Stock Exchange trading.
2. Nikkei Stock Average is based on a simple average of monthly closing prices.
3. Stock prices (high and low ) have been adjusted to reflect the two-for-one stock split completed on May 19, 2000.
Japanese
Securities Firms
Other Japanese
Corporations
Japanese Individuals
and OthersJapanese Financial InstitutionsForeign Institutions and Individuals
Trading Volume
(million shares)
Stock Price and
Nikkei Stock Average
(¥)
Nikkei Stock Average
2001 2002 2003
Number of Number of Number of Number of Number of Number of
Shares Held Shareholders Shares Held Shareholders Shares Held Shareholders
Foreign Institutions and Individuals 364,695,373 1,753 356,678,842 1,667 331,477,756 1,660
Japanese Financial Institutions 270,007,301 551 260,533,688 485 249,934,658 446
Japanese Individuals and Others 216,415,427 609,821 253,033,597 717,141 281,939,398 791,371
Other Japanese Corporations 55,029,317 5,666 47,924,895 5,755 51,973,659 6,017
Japanese Securities Firms 13,469,716 97 4,650,333 76 10,131,705 121
Total 919,617,134 617,888 922,816,355 725,124 925,457,176 799,615
Ownership and Distribution of Shares (Year ended March 31)
(Year ended March 31)
1999 2000 2001 2002 2003
Stock Price (¥)
At year-end 5,475 14,500 8,900 6,700 4,200
High 6,745 16,950 15,100 10,340 7,460
Low 3,615 5,360 7,510 3,960 4,070
Annual Increase/Decrease –3.1% +164.8% –38.6% –24.7% –37.3%
Number of Shares Outstanding at Year-end
(thousands of shares) 410,439 453,639 919,617 919,744 922,385
Market Capitalization at Year-end (trillion ¥) 4.49 13.16 8.18 6.16 3.87
Per Share of Common Stock Data (¥)
Cash Dividends Applicable to the Year 25.0 25.0 25.0 25.0 25.0
Net Income (Diluted) 195.51 131.70 19.28 16.67 118.21
Stockholders’ Equity 2,224.35 2,409.36 2,521.19 2,570.31 2,466.81
Note: Stock Prices and Per Share Data have been adjusted to reflect the two-for-one stock split completed on May 19, 2000. How ever, no adjustment to
reflect such stock split has been made to the Number of Shares Outstanding at year-end.
(Year ended March 31)
1999 2000 2001 2002 2003