Sony 2003 Annual Report Download - page 54
Download and view the complete annual report
Please find page 54 of the 2003 Sony annual report below. You can navigate through the pages in the report by either clicking on the pages listed below, or by using the keyword search tool below to find specific information within the annual report.-
 1
1 -
2
-
3
-
4
-
5
-
6
-
7
-
8
-
9
-
10
-
11
-
12
-
13
-
14
-
15
-
16
-
17
-
18
-
19
-
20
-
21
-
22
-
23
-
24
-
25
-
26
-
27
-
28
-
29
-
30
-
31
-
32
-
33
-
34
-
35
-
36
-
37
-
38
-
39
-
40
-
41
-
42
-
43
-
 44
44 -
 45
45 -
 46
46 -
 47
47 -
 48
48 -
 49
49 -
 50
50 -
 51
51 -
 52
52 -
 53
53 -
 54
54 -
 55
55 -
 56
56 -
 57
57 -
 58
58 -
 59
59 -
 60
60 -
 61
61 -
 62
62 -
 63
63 -
 64
64 -
65
-
66
-
67
-
68
-
69
-
70
-
71
-
72
-
73
-
74
-
75
-
76
-
77
-
78
-
79
-
80
-
81
-
82
-
83
-
84
-
85
-
86
-
87
-
88
-
89
-
90
-
91
-
92
-
93
-
94
-
95
-
96
-
97
-
98
-
99
-
100
-
101
-
102
-
103
-
104
-
105
-
106
-
107
-
108
-
109
-
110
-
111
-
112
-
113
-
114
-
115
-
116
-
117
-
118
-
119
-
120
-
121
-
122
-
123
-
124
-
125
-
126
-
127
-
128
-
129
-
130
-
131
-
132
-
133
-
134
-
135
-
136
-
137
-
138
-
139
-
140
-
141
-
142
-
143
-
144
-
145
-
146
-
147
-
148
-
149
-
150
-
151
-
152
-
153
-
154
-
155
-
156
-
157
-
158
-
159
-
160
-
161
-
162
-
163
-
164
-
165
-
166
-
167
-
168
-
169
-
170
-
171
-
172
-
173
-
174
-
175
-
176
-
177
-
178
-
179
-
180
-
181
-
182
-
183
-
184
-
185
-
186
-
187
-
188
-
189
-
190
-
191
-
192
-
193
-
194
-
195
-
196
-
197
-
198
-
199
-
200
-
201
-
202
-
203
-
204
-
205
-
206
-
207
-
208
-
209
-
210
-
211
-
212
-
213
-
214
-
215
-
216
-
217
-
218
-
219
-
220
-
221
-
222
-
223
-
224
-
225
-
226
-
227
-
228
-
229
-
230
-
231
-
232
-
233
 |
 |

Sony Corporation Annual Report 200352
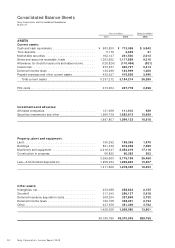
Consolidated Balance Sheets
Sony Corporation and Consolidated Subsidiaries
March 31
Yen in millions Dollars in millions*
2002 2003 2003
ASSETS
Current assets:
Cash and cash equivalents . . . . . . . . . . . . . . . . . . . . . . . . . ¥ 683,800 ¥ 713,058 $ 5,942
Time deposits . . . . . . . . . . . . . . . . . . . . . . . . . . . . . . . . . . . 5,176 3,689 31
Marketable securities . . . . . . . . . . . . . . . . . . . . . . . . . . . . . 162,147 241,520 2,013
Notes and accounts receivable, trade . . . . . . . . . . . . . . . . . 1,363,652 1,117,889 9,316
Allowance for doubtful accounts and sales returns . . . . . . . (120,826) (110,494) (921)
Inventories . . . . . . . . . . . . . . . . . . . . . . . . . . . . . . . . . . . . . 673,437 625,727 5,214
Deferred income taxes . . . . . . . . . . . . . . . . . . . . . . . . . . . . 134,299 143,999 1,200
Prepaid expenses and other current assets . . . . . . . . . . . . . 435,527 418,826 3,490
Total current assets . . . . . . . . . . . . . . . . . . . . . . . . . . . . 3,337,212 3,154,214 26,285
Film costs . . . . . . . . . . . . . . . . . . . . . . . . . . . . . . . . . . . . . . 313,054 287,778 2,398
Investments and advances:
Affiliated companies. . . . . . . . . . . . . . . . . . . . . . . . . . . . . . 131,068 111,510 929
Securities investments and other. . . . . . . . . . . . . . . . . . . . . 1,566,739 1,882,613 15,689
1,697,807 1,994,123 16,618
Property, plant and equipment:
Land . . . . . . . . . . . . . . . . . . . . . . . . . . . . . . . . . . . . . . . . . . 195,292 188,365 1,570
Buildings . . . . . . . . . . . . . . . . . . . . . . . . . . . . . . . . . . . . . . 891,436 872,228 7,269
Machinery and equipment . . . . . . . . . . . . . . . . . . . . . . . . . 2,216,347 2,054,219 17,118
Construction in progress. . . . . . . . . . . . . . . . . . . . . . . . . . . 66,825 60,383 503
3,369,900 3,175,195 26,460
Less—Accumulated depreciation . . . . . . . . . . . . . . . . . . . . 1,958,234 1,896,845 15,807
1,411,666 1,278,350 10,653
Other assets:
Intangibles, net . . . . . . . . . . . . . . . . . . . . . . . . . . . . . . . . . . 233,088 258,624 2,155
Goodwill . . . . . . . . . . . . . . . . . . . . . . . . . . . . . . . . . . . . . . 317,240 290,127 2,418
Deferred insurance acquisition costs . . . . . . . . . . . . . . . . . . 308,204 327,869 2,732
Deferred income taxes . . . . . . . . . . . . . . . . . . . . . . . . . . . . 120,168 328,091 2,734
Other . . . . . . . . . . . . . . . . . . . . . . . . . . . . . . . . . . . . . . . . . 447,356 451,369 3,762
1,426,056 1,656,080 13,801
¥8,185,795 ¥8,370,545 $69,755