Sony 2003 Annual Report Download - page 122
Download and view the complete annual report
Please find page 122 of the 2003 Sony annual report below. You can navigate through the pages in the report by either clicking on the pages listed below, or by using the keyword search tool below to find specific information within the annual report.-
 1
1 -
2
-
3
-
4
-
5
-
6
-
7
-
8
-
9
-
10
-
11
-
12
-
13
-
14
-
15
-
16
-
17
-
18
-
19
-
20
-
21
-
22
-
23
-
24
-
25
-
26
-
27
-
28
-
29
-
30
-
31
-
32
-
33
-
34
-
35
-
36
-
37
-
38
-
39
-
40
-
41
-
42
-
43
-
44
-
45
-
46
-
47
-
48
-
49
-
50
-
51
-
52
-
53
-
54
-
55
-
56
-
57
-
58
-
59
-
60
-
61
-
62
-
63
-
64
-
65
-
66
-
67
-
68
-
69
-
70
-
71
-
72
-
73
-
74
-
75
-
76
-
77
-
78
-
79
-
80
-
81
-
82
-
83
-
84
-
85
-
86
-
87
-
88
-
89
-
90
-
91
-
92
-
93
-
94
-
95
-
96
-
97
-
98
-
99
-
100
-
101
-
102
-
103
-
104
-
105
-
106
-
107
-
108
-
109
-
110
-
111
-
 112
112 -
 113
113 -
 114
114 -
 115
115 -
 116
116 -
 117
117 -
 118
118 -
 119
119 -
 120
120 -
 121
121 -
 122
122 -
 123
123 -
 124
124 -
 125
125 -
 126
126 -
 127
127 -
 128
128 -
 129
129 -
 130
130 -
 131
131 -
 132
132 -
133
-
134
-
135
-
136
-
137
-
138
-
139
-
140
-
141
-
142
-
143
-
144
-
145
-
146
-
147
-
148
-
149
-
150
-
151
-
152
-
153
-
154
-
155
-
156
-
157
-
158
-
159
-
160
-
161
-
162
-
163
-
164
-
165
-
166
-
167
-
168
-
169
-
170
-
171
-
172
-
173
-
174
-
175
-
176
-
177
-
178
-
179
-
180
-
181
-
182
-
183
-
184
-
185
-
186
-
187
-
188
-
189
-
190
-
191
-
192
-
193
-
194
-
195
-
196
-
197
-
198
-
199
-
200
-
201
-
202
-
203
-
204
-
205
-
206
-
207
-
208
-
209
-
210
-
211
-
212
-
213
-
214
-
215
-
216
-
217
-
218
-
219
-
220
-
221
-
222
-
223
-
224
-
225
-
226
-
227
-
228
-
229
-
230
-
231
-
232
-
233
 |
 |

Consolidated Financial Information 2003
36
deposits from customers in the banking business.
Accounting for all these factors and the effect of exchange rate changes, the total outstanding balance of cash
and cash equivalents at the end of the fiscal year increased 29.3 billion yen, or 4.3 percent, to 713.1 billion yen,
compared with the end of the previous fiscal year. The total outstanding balance of cash and cash equivalents of all
segments excluding the Financial Services segment increased 81.6 billion yen, or 22.9 percent, to 438.1 billion yen
and for the Financial Services segment decreased 52.3 billion, or 16.0 percent, to 274.9 billion yen, compared with
the previous fiscal year.
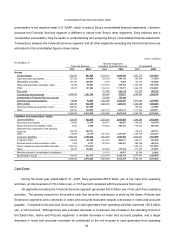
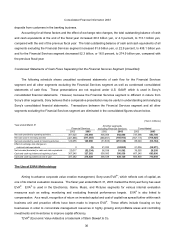
Condensed Statements of Cash Flows Separating Out the Financial Services Segment (Unaudited)
The following schedule shows unaudited condensed statements of cash flow for the Financial Services
segment and all other segments excluding the Financial Services segment as well as condensed consolidated
statements of cash flow. These presentations are not required under U.S. GAAP, which is used in Sony’s
consolidated financial statements. However, because the Financial Services segment is different in nature from
Sony’s other segments, Sony believes that a comparative presentation may be useful in understanding and analyzing
Sony’s consolidated financial statements. Transactions between the Financial Services segment and all other
segments excluding the Financial Services segment are eliminated in the consolidated figures shown below.
(Yen in millions)
Year ended March 31
Financial Services
All other segments
excluding Financial Services Consolidated
2002 2003 2002 2003 2002 2003
Net cash provided by operating activities . . . . . . . . . . . . 301,625 315,968 436,059 542,848 737,596 853,788
Net cash used in investing activities . . . . . . . . . . . . . . . . . . (401,866) (517,383) (368,951) (185,163) (767,117) (706,425)
Net cash provided by (used in) financing activities . . . . . . 120,255 149,086 (31,603) (251,128) 85,040 (93,134)
Effect of exchange rate changes on
cash and cash equivalents . . . . . . . . . . . . . . . . . . . . . . . . . 3 (5) 21,033 (24,965) 21,036 (24,971)
Net increase (decrease) in cash and cash equivalents . . . 20,017 (52,334) 56,538 81,592 76,555 29,258
Cash and cash equivalents at beginning of year . . . . . . . 307,245 327,262 300,000 356,538 607,245 683,800
Cash and cash equivalents at end of year . . . . . . . . . . . . 327,262 274,928 356,538 438,130 683,800 713,058
The Use of EVA® Methodology
Aiming to advance corporate value creation management, Sony uses EVA®*, which reflects cost of capital, as
one of its internal evaluation measures. The fiscal year ended March 31, 2003 marked the third year Sony has used
EVA®. EVA® is used in the Electronics, Game, Music, and Pictures segments for various internal evaluation
measures such as setting, monitoring and evaluating financial performance targets. EVA® is also linked to
compensation. As a result, recognition of return on invested capital and cost of capital has spread further within each
business unit and proactive efforts have been made to improve EVA®. These efforts include focusing on key
businesses in order to concentrate management resources in highly growing and profitable areas and controlling
investments and inventories to improve capital efficiency.
*EVA® (Economic Value Added) is a trademark of Stern Stewart & Co.