Sony 2003 Annual Report Download - page 229
Download and view the complete annual report
Please find page 229 of the 2003 Sony annual report below. You can navigate through the pages in the report by either clicking on the pages listed below, or by using the keyword search tool below to find specific information within the annual report.-
 1
1 -
2
-
3
-
4
-
5
-
6
-
7
-
8
-
9
-
10
-
11
-
12
-
13
-
14
-
15
-
16
-
17
-
18
-
19
-
20
-
21
-
22
-
23
-
24
-
25
-
26
-
27
-
28
-
29
-
30
-
31
-
32
-
33
-
34
-
35
-
36
-
37
-
38
-
39
-
40
-
41
-
42
-
43
-
44
-
45
-
46
-
47
-
48
-
49
-
50
-
51
-
52
-
53
-
54
-
55
-
56
-
57
-
58
-
59
-
60
-
61
-
62
-
63
-
64
-
65
-
66
-
67
-
68
-
69
-
70
-
71
-
72
-
73
-
74
-
75
-
76
-
77
-
78
-
79
-
80
-
81
-
82
-
83
-
84
-
85
-
86
-
87
-
88
-
89
-
90
-
91
-
92
-
93
-
94
-
95
-
96
-
97
-
98
-
99
-
100
-
101
-
102
-
103
-
104
-
105
-
106
-
107
-
108
-
109
-
110
-
111
-
112
-
113
-
114
-
115
-
116
-
117
-
118
-
119
-
120
-
121
-
122
-
123
-
124
-
125
-
126
-
127
-
128
-
129
-
130
-
131
-
132
-
133
-
134
-
135
-
136
-
137
-
138
-
139
-
140
-
141
-
142
-
143
-
144
-
145
-
146
-
147
-
148
-
149
-
150
-
151
-
152
-
153
-
154
-
155
-
156
-
157
-
158
-
159
-
160
-
161
-
162
-
163
-
164
-
165
-
166
-
167
-
168
-
169
-
170
-
171
-
172
-
173
-
174
-
175
-
176
-
177
-
178
-
179
-
180
-
181
-
182
-
183
-
184
-
185
-
186
-
187
-
188
-
189
-
190
-
191
-
192
-
193
-
194
-
195
-
196
-
197
-
198
-
199
-
200
-
201
-
202
-
203
-
204
-
205
-
206
-
207
-
208
-
209
-
210
-
211
-
212
-
213
-
214
-
215
-
216
-
217
-
218
-
 219
219 -
 220
220 -
 221
221 -
 222
222 -
 223
223 -
 224
224 -
 225
225 -
 226
226 -
 227
227 -
 228
228 -
 229
229 -
 230
230 -
 231
231 -
 232
232 -
 233
233
 |
 |

Consolidated Financial Information 2003
- 143 -
Yen in millions
Dollars in
millions
Year ended March 31
Year ended
March 31,
2001 2002 2003 2003
Audio ¥756,393 ¥747,469 ¥682,517 $5,688
Video 791,465 806,401 823,354 6,861
Televisions 797,618 842,388 846,139 7,051
Information and Communications 1,260,531 1,167,328 958,556 7,988
Semiconductors 237,668 182,276 204,710 1,706
Components 569,478 525,568 537,358 4,478
Other 569,279 501,120 490,679 4,089
Total ¥4,982,432 ¥4,772,550 ¥4,543,313 $37,861
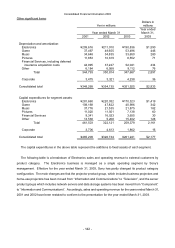
Geographic information -
Sales and operating revenue which are attributed to countries based on location of customers for the years
ended March 31, 2001, 2002 and 2003 and long-lived assets as of March 31, 2001, 2002 and 2003 are as
follows:
Yen in millions
Dollars in
millions
Year ended March 31
Year ended
March 31,
2001 2002 2003 2003
Sales and operating revenue:
Japan ¥2,400,777 ¥2,248,115 ¥2,093,880 $17,449
U.S.A. 2,179,833 2,461,523 2,403,946 20,033
Europe 1,473,780 1,609,111 1,665,976 13,883
Other 1,260,434 1,259,509 1,309,831 10,915
Total ¥7,314,824 ¥7,578,258 ¥7,473,633 $62,280
Yen in millions
Dollars in
millions
March 31 March 31,
2001 2002 2003 2003
Long-lived assets:
Japan ¥1,433,038 ¥1,462,709 ¥1,365,160 $11,376
U.S.A. 766,148 812,309 713,524 5,946
Europe 188,174 156,560 164,459 1,371
Other 160,249 174,070 148,616 1,238
Total ¥2,547,609 ¥2,605,648 ¥2,391,759 $19,931