Sony 2003 Annual Report Download - page 153
Download and view the complete annual report
Please find page 153 of the 2003 Sony annual report below. You can navigate through the pages in the report by either clicking on the pages listed below, or by using the keyword search tool below to find specific information within the annual report.-
 1
1 -
2
-
3
-
4
-
5
-
6
-
7
-
8
-
9
-
10
-
11
-
12
-
13
-
14
-
15
-
16
-
17
-
18
-
19
-
20
-
21
-
22
-
23
-
24
-
25
-
26
-
27
-
28
-
29
-
30
-
31
-
32
-
33
-
34
-
35
-
36
-
37
-
38
-
39
-
40
-
41
-
42
-
43
-
44
-
45
-
46
-
47
-
48
-
49
-
50
-
51
-
52
-
53
-
54
-
55
-
56
-
57
-
58
-
59
-
60
-
61
-
62
-
63
-
64
-
65
-
66
-
67
-
68
-
69
-
70
-
71
-
72
-
73
-
74
-
75
-
76
-
77
-
78
-
79
-
80
-
81
-
82
-
83
-
84
-
85
-
86
-
87
-
88
-
89
-
90
-
91
-
92
-
93
-
94
-
95
-
96
-
97
-
98
-
99
-
100
-
101
-
102
-
103
-
104
-
105
-
106
-
107
-
108
-
109
-
110
-
111
-
112
-
113
-
114
-
115
-
116
-
117
-
118
-
119
-
120
-
121
-
122
-
123
-
124
-
125
-
126
-
127
-
128
-
129
-
130
-
131
-
132
-
133
-
134
-
135
-
136
-
137
-
138
-
139
-
140
-
141
-
142
-
 143
143 -
 144
144 -
 145
145 -
 146
146 -
 147
147 -
 148
148 -
 149
149 -
 150
150 -
 151
151 -
 152
152 -
 153
153 -
 154
154 -
 155
155 -
 156
156 -
 157
157 -
 158
158 -
 159
159 -
 160
160 -
 161
161 -
 162
162 -
 163
163 -
164
-
165
-
166
-
167
-
168
-
169
-
170
-
171
-
172
-
173
-
174
-
175
-
176
-
177
-
178
-
179
-
180
-
181
-
182
-
183
-
184
-
185
-
186
-
187
-
188
-
189
-
190
-
191
-
192
-
193
-
194
-
195
-
196
-
197
-
198
-
199
-
200
-
201
-
202
-
203
-
204
-
205
-
206
-
207
-
208
-
209
-
210
-
211
-
212
-
213
-
214
-
215
-
216
-
217
-
218
-
219
-
220
-
221
-
222
-
223
-
224
-
225
-
226
-
227
-
228
-
229
-
230
-
231
-
232
-
233
 |
 |

Consolidated Financial Information 2003
- 67 -
Dollars in millions
Yen in millions (Note 3)
2001 2002 2003 2003
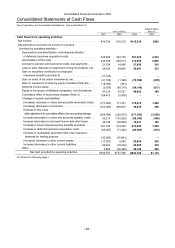
Cash flows from investing activities:
Payments for purchases of fixed assets . . . . . . . . . . . . . . . . . . . . ¥(468,019) ¥(388,514) ¥(275,285) $(2,294)
Proceeds from sales of fixed assets . . . . . . . . . . . . . . . . . . . . . . . 26,704 37,434 25,711 214
Payments for investments and advances by financial service
business . . . . . . . . . . . . . . . . . . . . . . . . . . . . . . . . . . . . . . . . . . . (329,319) (705,796) (1,026,361) (8,553)
Payments for investments and advances
(other than financial service business) . . . . . . . . . . . . . . . . . . . . . (136,818) (90,544) (109,987) (917)
Proceeds from sales of securities investments, maturities of
marketable securities and collections of advances by financial
service business. . . . . . . . . . . . . . . . . . . . . . . . . . . . . . . . . . . . . . . . . . . . . 93,226 345,112 542,539 4,521
Proceeds from sales of securities investments, maturities of
marketable securities and collections of advances (other than
financial service business) . . . . . . . . . . . . . . . . . . . . . . . . . . . . . . . 94,264 33,969 135,834 1,132
Decrease in time deposits . . . . . . . . . . . . . . . . . . . . . . . . . . . . . . . 914 1,222 1,124 10
Net cash used in investing activities . . . . . . . . . . . . . . . (719,048) (767,117) (706,425) (5,887)
Cash flows from financing activities:
Proceeds from issuance of long-term debt . . . . . . . . . . . . . . . . . . . 195,118 228,999 12,323 103
Payments of long-term debt . . . . . . . . . . . . . . . . . . . . . . . . . . . . . . . (143,258) (171,739) (238,144) (1,985)
Increase (decrease) in short-term borrowings . . . . . . . . . . . . . . . . 106,245 (78,104) (7,970) (66)
Increase in deposits from customers in the banking business
(Note 13) . . . . . . . . . . . . . . . . . . . . . . . . . . . . . . . . . . . . . . . . . . . . . – 106,472 142,023 1,184
Proceeds from issuance of subsidiary tracking stock (Note 16) . . . – 9,529 – –
Dividends paid . . . . . . . . . . . . . . . . . . . . . . . . . . . . . . . . . . . . . . . . (22,774) (22,951) (22,871) (191)
Other . . . . . . . . . . . . . . . . . . . . . . . . . . . . . . . . . . . . . . . . . . . . . . (889) 12,834 21,505 179
Net cash provided by (used in) financing activities . . . . 134,442 85,040 (93,134) (776)
Effect of exchange rate changes on cash and cash equivalents . . . 21,020 21,036 (24,971) (208)
Net increase (decrease) in cash and cash equivalents . . . . . . . . . . (18,819) 76,555 29,258 244
Cash and cash equivalents at beginning of year . . . . . . . . . . . . . . . . 626,064 607,245 683,800 5,698
Cash and cash equivalents at end of year . . . . . . . . . . . . . . . . . . . ¥607,245 ¥683,800 ¥713,058 $5,942
Supplemental data:
Cash paid during the year for –
Income taxes . . . . . . . . . . . . . . . . . . . . . . . . . . . . . . . . . . . . . . . . ¥93,629 ¥148,154 ¥171,531 $1,429
Interest . . . . . . . . . . . . . . . . . . . . . . . . . . . . . . . . . . . . . . . . . . . . . 47,806 35,371 22,216 185
Non-cash investing and financing activities –
Contribution of assets into an affiliated company . . . . . . . . . . . . – ¥10,545 – –
The accompanying notes are an integral part of these statements.
.