Sony 2003 Annual Report Download - page 226
Download and view the complete annual report
Please find page 226 of the 2003 Sony annual report below. You can navigate through the pages in the report by either clicking on the pages listed below, or by using the keyword search tool below to find specific information within the annual report.-
 1
1 -
2
-
3
-
4
-
5
-
6
-
7
-
8
-
9
-
10
-
11
-
12
-
13
-
14
-
15
-
16
-
17
-
18
-
19
-
20
-
21
-
22
-
23
-
24
-
25
-
26
-
27
-
28
-
29
-
30
-
31
-
32
-
33
-
34
-
35
-
36
-
37
-
38
-
39
-
40
-
41
-
42
-
43
-
44
-
45
-
46
-
47
-
48
-
49
-
50
-
51
-
52
-
53
-
54
-
55
-
56
-
57
-
58
-
59
-
60
-
61
-
62
-
63
-
64
-
65
-
66
-
67
-
68
-
69
-
70
-
71
-
72
-
73
-
74
-
75
-
76
-
77
-
78
-
79
-
80
-
81
-
82
-
83
-
84
-
85
-
86
-
87
-
88
-
89
-
90
-
91
-
92
-
93
-
94
-
95
-
96
-
97
-
98
-
99
-
100
-
101
-
102
-
103
-
104
-
105
-
106
-
107
-
108
-
109
-
110
-
111
-
112
-
113
-
114
-
115
-
116
-
117
-
118
-
119
-
120
-
121
-
122
-
123
-
124
-
125
-
126
-
127
-
128
-
129
-
130
-
131
-
132
-
133
-
134
-
135
-
136
-
137
-
138
-
139
-
140
-
141
-
142
-
143
-
144
-
145
-
146
-
147
-
148
-
149
-
150
-
151
-
152
-
153
-
154
-
155
-
156
-
157
-
158
-
159
-
160
-
161
-
162
-
163
-
164
-
165
-
166
-
167
-
168
-
169
-
170
-
171
-
172
-
173
-
174
-
175
-
176
-
177
-
178
-
179
-
180
-
181
-
182
-
183
-
184
-
185
-
186
-
187
-
188
-
189
-
190
-
191
-
192
-
193
-
194
-
195
-
196
-
197
-
198
-
199
-
200
-
201
-
202
-
203
-
204
-
205
-
206
-
207
-
208
-
209
-
210
-
211
-
212
-
213
-
214
-
215
-
 216
216 -
 217
217 -
 218
218 -
 219
219 -
 220
220 -
 221
221 -
 222
222 -
 223
223 -
 224
224 -
 225
225 -
 226
226 -
 227
227 -
 228
228 -
 229
229 -
 230
230 -
 231
231 -
 232
232 -
 233
233
 |
 |

Consolidated Financial Information 2003
- 140 -
various operating activities, primarily including a business focused on network service business including
Internet-related services, advertising agency business in Japan. Sony’s products and services are generally
unique to a single operating segment.
The operating segments reported below are the segments of Sony for which separate financial information
is available and for which operating profit or loss amounts are evaluated regularly by executive management in
deciding how to allocate resources and in assessing performance.
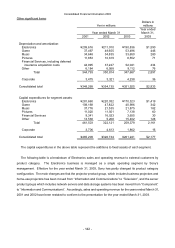
Business segments -
Sales and operating revenue:
Yen in millions
Dollars in
millions
Year ended March 31
Year ended
March 31,
2001 2002 2003 2003
Sales and operating revenue:
Electronics -
Customers ¥4,982,432 ¥4,772,550 ¥4,543,313 $37,861
Intersegment 472,082 513,631 397,137 3,309
Total 5,454,514 5,286,181 4,940,450 41,170
Game -
Customers 646,147 986,529 936,274 7,802
Intersegment 14,769 17,185 18,757 156
Total 660,916 1,003,714 955,031 7,958
Music -
Customers 571,003 588,191 559,042 4,659
Intersegment 41,110 54,649 77,256 644
Total 612,113 642,840 636,298 5,303
Pictures -
Customers 555,227 635,841 802,770 6,690
Intersegment 0 0 0 0
Total 555,227 635,841 802,770 6,690
Financial Services -
Customers 447,147 483,313 512,641 4,272
Intersegment 31,677 28,932 27,878 232
Total 478,824 512,245 540,519 4,504
Other -
Customers 112,868 111,834 119,593 996
Intersegment 93,942 91,977 130,721 1,090
Total 206,810 203,811 250,314 2,086
Elimination (653,580) (706,374) (651,749) (5,431)
Consolidated total ¥7,314,824 ¥7,578,258 ¥7,473,633 $62,280
Electronics intersegment amounts primarily consist of transactions with the Game business.
Music intersegment amounts primarily consist of transactions with the Game and Pictures businesses.
Other intersegment amounts primarily consist of transactions with the Electronics business.