Sony 2003 Annual Report Download - page 95
Download and view the complete annual report
Please find page 95 of the 2003 Sony annual report below. You can navigate through the pages in the report by either clicking on the pages listed below, or by using the keyword search tool below to find specific information within the annual report.-
 1
1 -
2
-
3
-
4
-
5
-
6
-
7
-
8
-
9
-
10
-
11
-
12
-
13
-
14
-
15
-
16
-
17
-
18
-
19
-
20
-
21
-
22
-
23
-
24
-
25
-
26
-
27
-
28
-
29
-
30
-
31
-
32
-
33
-
34
-
35
-
36
-
37
-
38
-
39
-
40
-
41
-
42
-
43
-
44
-
45
-
46
-
47
-
48
-
49
-
50
-
51
-
52
-
53
-
54
-
55
-
56
-
57
-
58
-
59
-
60
-
61
-
62
-
63
-
64
-
65
-
66
-
67
-
68
-
69
-
70
-
71
-
72
-
73
-
74
-
75
-
76
-
77
-
78
-
79
-
80
-
81
-
82
-
83
-
84
-
 85
85 -
 86
86 -
 87
87 -
 88
88 -
 89
89 -
 90
90 -
 91
91 -
 92
92 -
 93
93 -
 94
94 -
 95
95 -
 96
96 -
 97
97 -
 98
98 -
 99
99 -
 100
100 -
 101
101 -
 102
102 -
 103
103 -
 104
104 -
 105
105 -
106
-
107
-
108
-
109
-
110
-
111
-
112
-
113
-
114
-
115
-
116
-
117
-
118
-
119
-
120
-
121
-
122
-
123
-
124
-
125
-
126
-
127
-
128
-
129
-
130
-
131
-
132
-
133
-
134
-
135
-
136
-
137
-
138
-
139
-
140
-
141
-
142
-
143
-
144
-
145
-
146
-
147
-
148
-
149
-
150
-
151
-
152
-
153
-
154
-
155
-
156
-
157
-
158
-
159
-
160
-
161
-
162
-
163
-
164
-
165
-
166
-
167
-
168
-
169
-
170
-
171
-
172
-
173
-
174
-
175
-
176
-
177
-
178
-
179
-
180
-
181
-
182
-
183
-
184
-
185
-
186
-
187
-
188
-
189
-
190
-
191
-
192
-
193
-
194
-
195
-
196
-
197
-
198
-
199
-
200
-
201
-
202
-
203
-
204
-
205
-
206
-
207
-
208
-
209
-
210
-
211
-
212
-
213
-
214
-
215
-
216
-
217
-
218
-
219
-
220
-
221
-
222
-
223
-
224
-
225
-
226
-
227
-
228
-
229
-
230
-
231
-
232
-
233
 |
 |
Consolidated Financial Information 2003
9
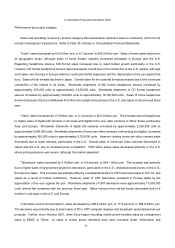
Performance by product category
Sales and operating revenue by product category discussed below represent sales to customers, which do not
include intersegment transactions. Refer to Note 25 of Notes to Consolidated Financial Statements.
“Audio” sales decreased by 65.0 billion yen, or 8.7 percent, to 682.5 billion yen. Sales of home audio declined in
all geographic areas, although sales of home theater systems increased principally in Europe and the U.S.
Regarding headphone stereos, MD format sales increased due to rapid market growth particularly in the U.S.
However, CD format headphone stereos sales decreased overall due to the contraction of the U.S. market, although
such sales rose strongly in Europe aided by continued market expansion and the depreciation of the yen against the
euro. Sales of both formats declined in Japan. Overall sales for the cassette format decreased due to the continued
contraction of the market in all areas. Worldwide shipments of MD format headphone stereos increased by
approximately 370,000 units to approximately 3,320,000 units. Worldwide shipments of CD format headphone
stereos increased by approximately 250,000 units to approximately 10,720,000 units. Sales of home telephones
declined because of Sony’s withdrawal from the home telephone business in the U.S. and Japan in the previous fiscal
year.
“Video” sales increased by 17.0 billion yen, or 2.1 percent, to 823.4 billion yen. The increase was principally due
to higher sales of digital still cameras in all areas and digital home-use video cameras in Other Areas, particularly
Asia, and Europe. Worldwide shipments of digital still cameras increased by approximately 2,200,000 units to
approximately 5,600,000 units. Worldwide shipments of home-use video cameras, both analog and digital, increased
by approximately 350,000 units to approximately 5,750,000 units. However, analog home-use video camera sales
decreased due to lower demand, particularly in the U.S. Overall sales of home-use video cameras decreased in
Japan and the U.S. due to increased price competition. DVD-Video player sales decreased primarily in the U.S.
where pricing pressure was severe, although the market expanded.
“Televisions” sales increased by 3.8 billion yen, or 0.4 percent, to 846.1 billion yen. The increase was primarily
due to higher sales of large-screen projection televisions, particularly in the U.S., and plasma televisions, in the U.S.,
Europe and Japan. This increase was partially offset by a substantial decline in CRT televisions sales in the U.S. and
Japan as a result of market contraction. However, sales of CRT televisions increased in Europe aided by the
appreciation of the euro against the yen. Worldwide shipments of CRT televisions were approximately 10,000,000
units, almost flat compared with the previous fiscal year. Sales revenue from set-top boxes decreased due to a
decline in unit sales in the U.S. and Europe.
“Information and Communications” sales decreased by 208.8 billion yen, or 17.9 percent, to 958.6 billion yen.
The decrease was primarily due to lower sales of PCs, CRT computer displays and broadcast- and professional-use
products. Further, since October 2001, when Sony began recording mobile phone handset sales as consignment
sales to SEMC in “Other”, no sales of mobile phone handsets have been recorded under “Information and