Sony 2003 Annual Report Download - page 2
Download and view the complete annual report
Please find page 2 of the 2003 Sony annual report below. You can navigate through the pages in the report by either clicking on the pages listed below, or by using the keyword search tool below to find specific information within the annual report.-
 1
1 -
 2
2 -
 3
3 -
 4
4 -
 5
5 -
 6
6 -
 7
7 -
 8
8 -
 9
9 -
 10
10 -
 11
11 -
 12
12 -
 13
13 -
14
-
15
-
16
-
17
-
18
-
19
-
20
-
21
-
22
-
23
-
24
-
25
-
26
-
27
-
28
-
29
-
30
-
31
-
32
-
33
-
34
-
35
-
36
-
37
-
38
-
39
-
40
-
41
-
42
-
43
-
44
-
45
-
46
-
47
-
48
-
49
-
50
-
51
-
52
-
53
-
54
-
55
-
56
-
57
-
58
-
59
-
60
-
61
-
62
-
63
-
64
-
65
-
66
-
67
-
68
-
69
-
70
-
71
-
72
-
73
-
74
-
75
-
76
-
77
-
78
-
79
-
80
-
81
-
82
-
83
-
84
-
85
-
86
-
87
-
88
-
89
-
90
-
91
-
92
-
93
-
94
-
95
-
96
-
97
-
98
-
99
-
100
-
101
-
102
-
103
-
104
-
105
-
106
-
107
-
108
-
109
-
110
-
111
-
112
-
113
-
114
-
115
-
116
-
117
-
118
-
119
-
120
-
121
-
122
-
123
-
124
-
125
-
126
-
127
-
128
-
129
-
130
-
131
-
132
-
133
-
134
-
135
-
136
-
137
-
138
-
139
-
140
-
141
-
142
-
143
-
144
-
145
-
146
-
147
-
148
-
149
-
150
-
151
-
152
-
153
-
154
-
155
-
156
-
157
-
158
-
159
-
160
-
161
-
162
-
163
-
164
-
165
-
166
-
167
-
168
-
169
-
170
-
171
-
172
-
173
-
174
-
175
-
176
-
177
-
178
-
179
-
180
-
181
-
182
-
183
-
184
-
185
-
186
-
187
-
188
-
189
-
190
-
191
-
192
-
193
-
194
-
195
-
196
-
197
-
198
-
199
-
200
-
201
-
202
-
203
-
204
-
205
-
206
-
207
-
208
-
209
-
210
-
211
-
212
-
213
-
214
-
215
-
216
-
217
-
218
-
219
-
220
-
221
-
222
-
223
-
224
-
225
-
226
-
227
-
228
-
229
-
230
-
231
-
232
-
233
 |
 |

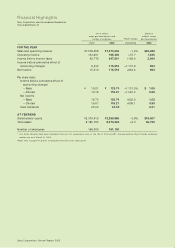
Financial Highlights
Sony Corporation and Consolidated Subsidiaries
Year ended March 31
Sony Corporation Annual Report 2003
Yen in millions Dollars in
except per share amounts and millions* except
number of employees per share amounts
2002 2003 2003/2002 2003
FOR THE YEAR
Sales and operating revenue ¥7,578,258 ¥7,473,633 –1.4% $62,280
Operating income 134,631 185,440 +37.7 1,545
Income before income taxes 92,775 247,621 +166.9 2,064
Income before cumulative effect of
accounting changes 9,332 115,519 +1,137.9 963
Net income 15,310 115,519 +654.5 963
Per share data:
Income before cumulative effect of
accounting changes
—Basic ¥ 10.21 ¥ 125.74 +1,131.5% $ 1.05
—Diluted 10.18 118.21 +1,061.2 0.99
Net income
—Basic 16.72 125.74 +652.0 1.05
—Diluted 16.67 118.21 +609.1 0.99
Cash dividends 25.00 25.00 0.21
AT YEAR-END
Stockholders’ equity ¥2,370,410 ¥2,280,895 –3.8% $19,007
Total assets 8,185,795 8,370,545 +2.3 69,755
Number of employees 168,000 161,100
*U.S. dollar amounts have been translated from yen, for convenience only, at the rate of ¥120=U.S.$1, the approximate Tokyo foreign exchange
market rate as of March 31, 2003.
Please refer to pages 61 and 62 for detailed footnotes to the table above.
Percent change