Sony 2003 Annual Report Download - page 230
Download and view the complete annual report
Please find page 230 of the 2003 Sony annual report below. You can navigate through the pages in the report by either clicking on the pages listed below, or by using the keyword search tool below to find specific information within the annual report.-
 1
1 -
2
-
3
-
4
-
5
-
6
-
7
-
8
-
9
-
10
-
11
-
12
-
13
-
14
-
15
-
16
-
17
-
18
-
19
-
20
-
21
-
22
-
23
-
24
-
25
-
26
-
27
-
28
-
29
-
30
-
31
-
32
-
33
-
34
-
35
-
36
-
37
-
38
-
39
-
40
-
41
-
42
-
43
-
44
-
45
-
46
-
47
-
48
-
49
-
50
-
51
-
52
-
53
-
54
-
55
-
56
-
57
-
58
-
59
-
60
-
61
-
62
-
63
-
64
-
65
-
66
-
67
-
68
-
69
-
70
-
71
-
72
-
73
-
74
-
75
-
76
-
77
-
78
-
79
-
80
-
81
-
82
-
83
-
84
-
85
-
86
-
87
-
88
-
89
-
90
-
91
-
92
-
93
-
94
-
95
-
96
-
97
-
98
-
99
-
100
-
101
-
102
-
103
-
104
-
105
-
106
-
107
-
108
-
109
-
110
-
111
-
112
-
113
-
114
-
115
-
116
-
117
-
118
-
119
-
120
-
121
-
122
-
123
-
124
-
125
-
126
-
127
-
128
-
129
-
130
-
131
-
132
-
133
-
134
-
135
-
136
-
137
-
138
-
139
-
140
-
141
-
142
-
143
-
144
-
145
-
146
-
147
-
148
-
149
-
150
-
151
-
152
-
153
-
154
-
155
-
156
-
157
-
158
-
159
-
160
-
161
-
162
-
163
-
164
-
165
-
166
-
167
-
168
-
169
-
170
-
171
-
172
-
173
-
174
-
175
-
176
-
177
-
178
-
179
-
180
-
181
-
182
-
183
-
184
-
185
-
186
-
187
-
188
-
189
-
190
-
191
-
192
-
193
-
194
-
195
-
196
-
197
-
198
-
199
-
200
-
201
-
202
-
203
-
204
-
205
-
206
-
207
-
208
-
209
-
210
-
211
-
212
-
213
-
214
-
215
-
216
-
217
-
218
-
219
-
 220
220 -
 221
221 -
 222
222 -
 223
223 -
 224
224 -
 225
225 -
 226
226 -
 227
227 -
 228
228 -
 229
229 -
 230
230 -
 231
231 -
 232
232 -
 233
233
 |
 |

Consolidated Financial Information 2003
- 144 -
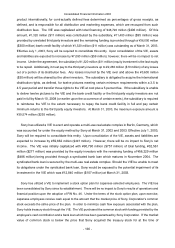
There are not any individually material countries with respect to the sales and operating revenue and
long-lived assets included in Europe and Other areas.
Transfers between reportable business or geographic segments are made at arms-length prices.
There are no sales and operating revenue with a single major external customer for the years ended March
31, 2001, 2002 and 2003.
The following information shows sales and operating revenue and operating income by geographic origin
for the years ended March 31, 2001, 2002 and 2003. In addition to the disclosure requirements under FAS No.
131, Sony discloses this supplemental information in accordance with disclosure requirements of the
Japanese Securities and Exchange Law, to which Sony, as a Japanese public company, is subject.
Yen in millions
Dollars in
millions
Year ended March 31
Year ended
March 31,
2001 2002 2003 2003
Sales and operating revenue:
Japan -
Customers ¥2,753,063 ¥2,498,641 ¥2,247,030 $18,725
Intersegment 2,322,037 2,312,718 2,433,998 20,283
Total 5,075,100 4,811,359 4,681,028 39,008
U.S.A. -
Customers 2,315,985 2,637,861 2,632,176 21,935
Intersegment 184,581 184,966 189,502 1,579
Total 2,500,566 2,822,827 2,821,678 23,514
Europe -
Customers 1,305,013 1,440,281 1,520,930 12,674
Intersegment 48,991 91,329 121,598 1,013
Total 1,354,004 1,531,610 1,642,528 13,687
Other -
Customers 940,763 1,001,475 1,073,497 8,946
Intersegment 852,648 853,324 789,444 6,579
Total 1,793,411 1,854,799 1,862,941 15,525
Elimination (3,408,257) (3,442,337) (3,534,542) (29,454)
Consolidated total ¥7,314,824 ¥7,578,258 ¥7,473,633 $62,280
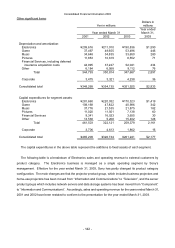
Operating income:
Japan ¥155,674 ¥36,188 ¥11,444 $95
U.S.A. 23,131 30,704 98,762 823
Europe 11,641 24,460 62,206 518
Other 71,059 76,061 63,773 532
Corporate and elimination (36,159) (32,782) (50,745) (423)
Consolidated total ¥225,346 ¥134,631 ¥185,440 $1,545