Sony 2003 Annual Report Download - page 144
Download and view the complete annual report
Please find page 144 of the 2003 Sony annual report below. You can navigate through the pages in the report by either clicking on the pages listed below, or by using the keyword search tool below to find specific information within the annual report.-
 1
1 -
2
-
3
-
4
-
5
-
6
-
7
-
8
-
9
-
10
-
11
-
12
-
13
-
14
-
15
-
16
-
17
-
18
-
19
-
20
-
21
-
22
-
23
-
24
-
25
-
26
-
27
-
28
-
29
-
30
-
31
-
32
-
33
-
34
-
35
-
36
-
37
-
38
-
39
-
40
-
41
-
42
-
43
-
44
-
45
-
46
-
47
-
48
-
49
-
50
-
51
-
52
-
53
-
54
-
55
-
56
-
57
-
58
-
59
-
60
-
61
-
62
-
63
-
64
-
65
-
66
-
67
-
68
-
69
-
70
-
71
-
72
-
73
-
74
-
75
-
76
-
77
-
78
-
79
-
80
-
81
-
82
-
83
-
84
-
85
-
86
-
87
-
88
-
89
-
90
-
91
-
92
-
93
-
94
-
95
-
96
-
97
-
98
-
99
-
100
-
101
-
102
-
103
-
104
-
105
-
106
-
107
-
108
-
109
-
110
-
111
-
112
-
113
-
114
-
115
-
116
-
117
-
118
-
119
-
120
-
121
-
122
-
123
-
124
-
125
-
126
-
127
-
128
-
129
-
130
-
131
-
132
-
133
-
 134
134 -
 135
135 -
 136
136 -
 137
137 -
 138
138 -
 139
139 -
 140
140 -
 141
141 -
 142
142 -
 143
143 -
 144
144 -
 145
145 -
 146
146 -
 147
147 -
 148
148 -
 149
149 -
 150
150 -
 151
151 -
 152
152 -
 153
153 -
 154
154 -
155
-
156
-
157
-
158
-
159
-
160
-
161
-
162
-
163
-
164
-
165
-
166
-
167
-
168
-
169
-
170
-
171
-
172
-
173
-
174
-
175
-
176
-
177
-
178
-
179
-
180
-
181
-
182
-
183
-
184
-
185
-
186
-
187
-
188
-
189
-
190
-
191
-
192
-
193
-
194
-
195
-
196
-
197
-
198
-
199
-
200
-
201
-
202
-
203
-
204
-
205
-
206
-
207
-
208
-
209
-
210
-
211
-
212
-
213
-
214
-
215
-
216
-
217
-
218
-
219
-
220
-
221
-
222
-
223
-
224
-
225
-
226
-
227
-
228
-
229
-
230
-
231
-
232
-
233
 |
 |

Consolidated Financial Information 2003
58
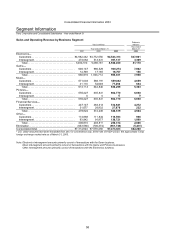
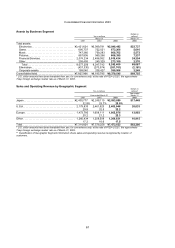
Segment Information
Sony Corporation and Consolidated Subsidiaries - Year ended March 31
Sales and Operating Revenue by Business Segment
Dollars in
Yen in millions millions*
Year ended
Year ended March 31 March 31
2001 2002 2003 2003
Electronics—
Customers . . . . . . . . . . . . . . . . . . . . . . . . . . . . . . . . ¥4,982,432 ¥4,772,550 ¥4,543,313 $37,861
Intersegment . . . . . . . . . . . . . . . . . . . . . . . . . . . . . . 472,082 513,631 397,137 3,309
Total . . . . . . . . . . . . . . . . . . . . . . . . . . . . . . . . . . . 5,454,514 5,286,181 4,940,450 41,170
Game—
Customers . . . . . . . . . . . . . . . . . . . . . . . . . . . . . . . . 646,147 986,529 936,274 7,802
Intersegment . . . . . . . . . . . . . . . . . . . . . . . . . . . . . . 14,769 17,185 18,757 156
Total . . . . . . . . . . . . . . . . . . . . . . . . . . . . . . . . . . . 660,916 1,003,714 955,031 7,958
Music—
Customers . . . . . . . . . . . . . . . . . . . . . . . . . . . . . . . . 571,003 588,191 559,042 4,659
Intersegment . . . . . . . . . . . . . . . . . . . . . . . . . . . . . . 41,110 54,649 77,256 644
Total . . . . . . . . . . . . . . . . . . . . . . . . . . . . . . . . . . . 612,113 642,840 636,298 5,303
Pictures—
Customers . . . . . . . . . . . . . . . . . . . . . . . . . . . . . . . . 555,227 635,841 802,770 6,690
Intersegment . . . . . . . . . . . . . . . . . . . . . . . . . . . . . . 00 0 0
Total . . . . . . . . . . . . . . . . . . . . . . . . . . . . . . . . . . . 555,227 635,841 802,770 6,690
Financial Services—
Customers . . . . . . . . . . . . . . . . . . . . . . . . . . . . . . . . 447,147 483,313 512,641 4,272
Intersegment . . . . . . . . . . . . . . . . . . . . . . . . . . . . . . 31,677 28,932 27,878 232
Total . . . . . . . . . . . . . . . . . . . . . . . . . . . . . . . . . . . 478,824 512,245 540,519 4,504
Other—
Customers . . . . . . . . . . . . . . . . . . . . . . . . . . . . . . . . 112,868 111,834 119,593 996
Intersegment . . . . . . . . . . . . . . . . . . . . . . . . . . . . . . 93,942 91,977 130,721 1,090
Total . . . . . . . . . . . . . . . . . . . . . . . . . . . . . . . . . . . 206,810 203,811 250,314 2,086
Elimination. . . . . . . . . . . . . . . . . . . . . . . . . . . . . . . . . . (653,580) (706,374) (651,749) (5,431)
Consolidated total . . . . . . . . . . . . . . . . . . . . . . . . . . . . ¥7,314,824 ¥7,578,258 ¥7,473,633 $62,280
* U.S. dollar amounts have been translated from yen, for convenience only, at the rate of ¥120=U.S.$1, the approximate Tokyo
foreign exchange market rate as of March 31, 2003.
*
Note: Electronics intersegment amounts primarily consist of transactions with the Game business.
Note: Music intersegment amounts primarily consist of transactions with the Game and Pictures businesses.
Note: Other intersegment amounts primarily consist of transactions with the Electronics business.