Sony 2003 Annual Report Download - page 73
Download and view the complete annual report
Please find page 73 of the 2003 Sony annual report below. You can navigate through the pages in the report by either clicking on the pages listed below, or by using the keyword search tool below to find specific information within the annual report.-
 1
1 -
2
-
3
-
4
-
5
-
6
-
7
-
8
-
9
-
10
-
11
-
12
-
13
-
14
-
15
-
16
-
17
-
18
-
19
-
20
-
21
-
22
-
23
-
24
-
25
-
26
-
27
-
28
-
29
-
30
-
31
-
32
-
33
-
34
-
35
-
36
-
37
-
38
-
39
-
40
-
41
-
42
-
43
-
44
-
45
-
46
-
47
-
48
-
49
-
50
-
51
-
52
-
53
-
54
-
55
-
56
-
57
-
58
-
59
-
60
-
61
-
62
-
 63
63 -
 64
64 -
 65
65 -
 66
66 -
 67
67 -
 68
68 -
 69
69 -
 70
70 -
 71
71 -
 72
72 -
 73
73 -
 74
74 -
 75
75 -
 76
76 -
 77
77 -
 78
78 -
 79
79 -
 80
80 -
 81
81 -
 82
82 -
 83
83 -
84
-
85
-
86
-
87
-
88
-
89
-
90
-
91
-
92
-
93
-
94
-
95
-
96
-
97
-
98
-
99
-
100
-
101
-
102
-
103
-
104
-
105
-
106
-
107
-
108
-
109
-
110
-
111
-
112
-
113
-
114
-
115
-
116
-
117
-
118
-
119
-
120
-
121
-
122
-
123
-
124
-
125
-
126
-
127
-
128
-
129
-
130
-
131
-
132
-
133
-
134
-
135
-
136
-
137
-
138
-
139
-
140
-
141
-
142
-
143
-
144
-
145
-
146
-
147
-
148
-
149
-
150
-
151
-
152
-
153
-
154
-
155
-
156
-
157
-
158
-
159
-
160
-
161
-
162
-
163
-
164
-
165
-
166
-
167
-
168
-
169
-
170
-
171
-
172
-
173
-
174
-
175
-
176
-
177
-
178
-
179
-
180
-
181
-
182
-
183
-
184
-
185
-
186
-
187
-
188
-
189
-
190
-
191
-
192
-
193
-
194
-
195
-
196
-
197
-
198
-
199
-
200
-
201
-
202
-
203
-
204
-
205
-
206
-
207
-
208
-
209
-
210
-
211
-
212
-
213
-
214
-
215
-
216
-
217
-
218
-
219
-
220
-
221
-
222
-
223
-
224
-
225
-
226
-
227
-
228
-
229
-
230
-
231
-
232
-
233
 |
 |
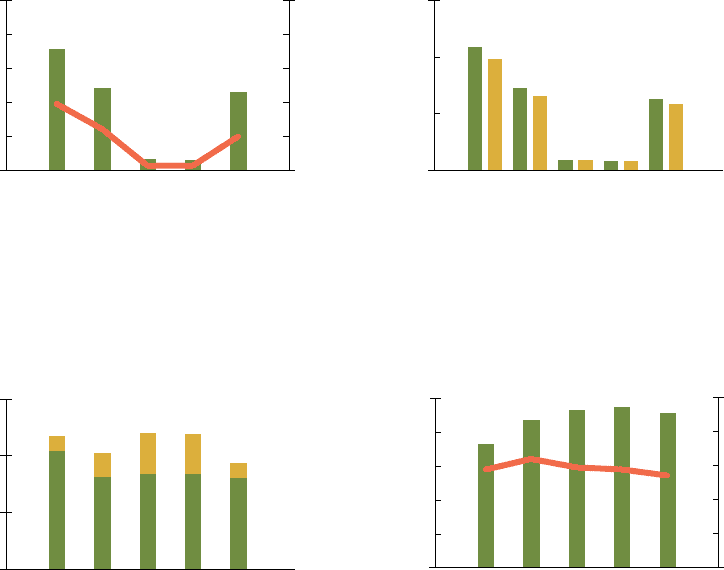
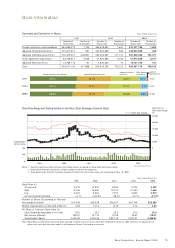
Sony Corporation Annual Report 2003 71
■ Net income
■
ROE
* Year ended March 31
■ Basic
■ Diluted
* Year ended M arch 31
*Restated to reflect the two-for-one stock split effective
May 19, 2000
■ Short-term (Including the current portion of long-term debt)
■ Long-term
* As of March 31
■ Stockholders’ equity
■
Stockholders’ equity ratio
* As of March 31
(Billion ¥) (Billion ¥) (% )
(Billion ¥) (% ) (¥)
Stockholders’ equity and stockholders’ equity ratio
Net income and ROE Net income per share of common stock
Interest-bearing liabilities
99 00 01 02 03
0
50
100
150
200
250
0
5
10
15
20
25
0.7%
0.7%
6.1%
9.8%
5.0%
0
100
200
300
99 00 01 02 03
99 00 01 02 03
0
500
1,000
1,500
99 00 01 02 03
0
500
1,000
1,500
2,000
2,500
0
10
20
30
40
50
29.0%
29.6%
32.1%
29.0% 27.2%