Sony 2003 Annual Report Download - page 152
Download and view the complete annual report
Please find page 152 of the 2003 Sony annual report below. You can navigate through the pages in the report by either clicking on the pages listed below, or by using the keyword search tool below to find specific information within the annual report.-
 1
1 -
2
-
3
-
4
-
5
-
6
-
7
-
8
-
9
-
10
-
11
-
12
-
13
-
14
-
15
-
16
-
17
-
18
-
19
-
20
-
21
-
22
-
23
-
24
-
25
-
26
-
27
-
28
-
29
-
30
-
31
-
32
-
33
-
34
-
35
-
36
-
37
-
38
-
39
-
40
-
41
-
42
-
43
-
44
-
45
-
46
-
47
-
48
-
49
-
50
-
51
-
52
-
53
-
54
-
55
-
56
-
57
-
58
-
59
-
60
-
61
-
62
-
63
-
64
-
65
-
66
-
67
-
68
-
69
-
70
-
71
-
72
-
73
-
74
-
75
-
76
-
77
-
78
-
79
-
80
-
81
-
82
-
83
-
84
-
85
-
86
-
87
-
88
-
89
-
90
-
91
-
92
-
93
-
94
-
95
-
96
-
97
-
98
-
99
-
100
-
101
-
102
-
103
-
104
-
105
-
106
-
107
-
108
-
109
-
110
-
111
-
112
-
113
-
114
-
115
-
116
-
117
-
118
-
119
-
120
-
121
-
122
-
123
-
124
-
125
-
126
-
127
-
128
-
129
-
130
-
131
-
132
-
133
-
134
-
135
-
136
-
137
-
138
-
139
-
140
-
141
-
 142
142 -
 143
143 -
 144
144 -
 145
145 -
 146
146 -
 147
147 -
 148
148 -
 149
149 -
 150
150 -
 151
151 -
 152
152 -
 153
153 -
 154
154 -
 155
155 -
 156
156 -
 157
157 -
 158
158 -
 159
159 -
 160
160 -
 161
161 -
 162
162 -
163
-
164
-
165
-
166
-
167
-
168
-
169
-
170
-
171
-
172
-
173
-
174
-
175
-
176
-
177
-
178
-
179
-
180
-
181
-
182
-
183
-
184
-
185
-
186
-
187
-
188
-
189
-
190
-
191
-
192
-
193
-
194
-
195
-
196
-
197
-
198
-
199
-
200
-
201
-
202
-
203
-
204
-
205
-
206
-
207
-
208
-
209
-
210
-
211
-
212
-
213
-
214
-
215
-
216
-
217
-
218
-
219
-
220
-
221
-
222
-
223
-
224
-
225
-
226
-
227
-
228
-
229
-
230
-
231
-
232
-
233
 |
 |

Consolidated Financial Information 2003
- 66 -
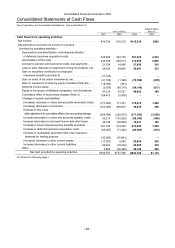
Consolidated Statements of Cash Flows
Sony Corporation and Consolidated Subsidiaries - Year ended March 31
Dollars in millions
Yen in millions (Note 3)
2001 2002 2003 2003
Cash flows from operating activities:
Net income . . . . . . . . . . . . . . . . . . . . . . . . . . . . . . . . . . . . . . . . . . ¥16,754 ¥15,310 ¥115,519 $963
Adjustments to reconcile net income to net cash
provided by operating activities –
Depreciation and amortization, including amortization
of deferred insurance acquisition costs . . . . . . . . . . . . . . . . . 348,268 354,135 351,925 2,933
Amortization of film costs . . . . . . . . . . . . . . . . . . . . . . . . . . . . 244,649 242,614 312,054 2,600
Accrual for pension and severance costs, less payments . . . . . 21,759 14,995 37,858 316
Loss on sale, disposal or impairment of long-lived assets, net . 24,304 49,862 39,941 333
Gain on securities contribution to employee
retirement benefit trust (Note 8) . . . . . . . . . . . . . . . . . . . . . . . (11,120) – – –
Gain on sales of securities investments, net . . . . . . . (41,708) (1,398) (72,552) (605)
Gain on issuances of stock by equity investees (Note 20) . . . . (18,030) (503) – –
Deferred income taxes . . . . . . . . . . . . . . . . . . . . . . . . . . . . . . . (5,579) (49,719) (98,016) (817)
Equity in net losses of affiliated companies, net of dividends . . 47,219 37,537 46,692 389
Cumulative effect of accounting changes (Note 2) . . . . . . . . . 104,473 (5,978) – –
Changes in assets and liabilities:
(Increase) decrease in notes and accounts receivable, trade. (177,484) 111,301 174,679 1,456
(Increase) decrease in inventories . . . . . . . . . . . . . . . . . . . . . (103,085) 290,872 36,039 300
Increase in film costs
(after adjustment for cumulative effect of an accounting change) . . (269,004) (236,072) (317,953) (2,650)
Increase (decrease) in notes and accounts payable, trade. . . 95,213 (172,626) (58,384) (486)
Increase (decrease) in accrued income and other taxes . . . . 38,749 (39,589) 14,637 122
Increase in future insurance policy benefits and other . . . . . . 241,140 314,405 233,992 1,950
Increase in deferred insurance acquisition costs . . . . . . . . . . . (68,927) (71,522) (66,091) (551)
Increase in marketable securities held in the insurance
business for trading purpose . . . . . . . . . . . . . . . . . . . . . . . . . (20,000) (55,661) – –
(Increase) decrease in other current assets . . . . . . . . . . . . . . (17,031) 5,543 29,095 242
Increase (decrease) in other current liabilities. . . . . . . . . . . . . 88,224 (19,418) 26,205 218
Other . . . . . . . . . . . . . . . . . . . . . . . . . . . . . . . . . . . . . . . . . . . . . 5,983 (46,492) 48,148 402
Net cash provided by operating activities . . . . . . . . . . . ¥544,767 ¥737,596 ¥853,788 $7,115
(Continued on following page.)