Electronic Arts 2006 Annual Report Download - page 105
Download and view the complete annual report
Please find page 105 of the 2006 Electronic Arts annual report below. You can navigate through the pages in the report by either clicking on the pages listed below, or by using the keyword search tool below to find specific information within the annual report.-
 1
1 -
2
-
3
-
4
-
5
-
6
-
7
-
8
-
9
-
10
-
11
-
12
-
13
-
14
-
15
-
16
-
17
-
18
-
19
-
20
-
21
-
22
-
23
-
24
-
25
-
26
-
27
-
28
-
29
-
30
-
31
-
32
-
33
-
34
-
35
-
36
-
37
-
38
-
39
-
40
-
41
-
42
-
43
-
44
-
45
-
46
-
47
-
48
-
49
-
50
-
51
-
52
-
53
-
54
-
55
-
56
-
57
-
58
-
59
-
60
-
61
-
62
-
63
-
64
-
65
-
66
-
67
-
68
-
69
-
70
-
71
-
72
-
73
-
74
-
75
-
76
-
77
-
78
-
79
-
80
-
81
-
82
-
83
-
84
-
85
-
86
-
87
-
88
-
89
-
90
-
91
-
92
-
93
-
94
-
 95
95 -
 96
96 -
 97
97 -
 98
98 -
 99
99 -
 100
100 -
 101
101 -
 102
102 -
 103
103 -
 104
104 -
 105
105 -
 106
106 -
 107
107 -
 108
108 -
 109
109 -
 110
110 -
 111
111 -
 112
112 -
 113
113 -
 114
114 -
 115
115 -
116
-
117
-
118
-
119
-
120
-
121
-
122
-
123
-
124
-
125
-
126
-
127
-
128
-
129
-
130
-
131
-
132
-
133
-
134
-
135
-
136
-
137
-
138
-
139
-
140
-
141
-
142
-
143
-
144
-
145
-
146
-
147
-
148
-
149
-
150
-
151
-
152
-
153
-
154
-
155
-
156
-
157
-
158
-
159
-
160
-
161
-
162
-
163
-
164
-
165
-
166
-
167
-
168
-
169
-
170
-
171
-
172
-
173
-
174
-
175
-
176
-
177
-
178
-
179
-
180
-
181
-
182
-
183
-
184
-
185
-
186
-
187
-
188
-
189
-
190
-
191
-
192
-
193
-
194
-
195
-
196
 |
 |

Item 7: Management's Discussion and Analysis of Financial Condition and Results of Operations
OVERVIEW
The following overview is a top-level discussion of our operating results as well as some of the trends and
drivers that aÅect our business. Management believes that an understanding of these trends and drivers is
important in order to understand our results for the Ñscal year ended March 31, 2006, as well as our future
prospects. This summary is not intended to be exhaustive, nor is it intended to be a substitute for the
detailed discussion and analysis provided elsewhere in this Form 10-K, including in the ""Business'' section
and the ""Risk Factors'' above, the remainder of ""Management's Discussion and Analysis of Financial
Condition and Results of Operations'', or the Consolidated Financial Statements and related notes.
About Electronic Arts
We develop, market, publish and distribute interactive software games that are playable by consumers on
home video game consoles (such as the Sony PlayStation» 2, Microsoft Xbox» and Xbox 360
TM
, and
Nintendo GameCube
TM
), personal computers, mobile platforms (including cellular handsets and hand-held
game players such as the Nintendo DS
TM
and the PlayStation» Portable ""PSP
TM
'') and online, over the
Internet and other proprietary online networks. Some of our games are based on content that we license
from others (e.g., Madden NFL Football, The Godfather and FIFA Soccer), and some of our games are
based on our own wholly-owned intellectual property (e.g., The Sims
TM
, Need for Speed
TM
and
BLACK
TM
). Our goal is to publish titles with mass-market appeal, which often means translating and
localizing them for sale in non-English speaking countries. In addition, we also attempt to create software
game ""franchises'' that allow us to publish new titles on a recurring basis that are based on the same
property. Examples of this franchise approach are the annual iterations of our sports-based products (e.g.,
Madden NFL Football, NCAA» Football and FIFA Soccer), wholly-owned properties that can be
successfully sequeled (e.g., The Sims, Need for Speed and BattleÑeld) and titles based on long-lived
literary movie properties (e.g. Lord of the Rings and Harry Potter).
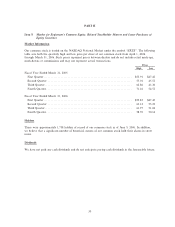
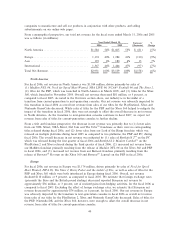
Overview of Financial Results
Total net revenue for the Ñscal year ended March 31, 2006 was $2.951 billion, down 6 percent as
compared to the Ñscal year ended March 31, 2005. Total net revenue for the Ñscal year ended March 31,
2006 was driven by sales of Need for Speed
TM
Most Wanted, Madden NFL 06, FIFA 06, The Sims
TM
2, and
Harry Potter and the Goblet of Fire
TM
. Four titles sold more than Ñve million units in the Ñscal year ended
March 31, 2006: Need for Speed Most Wanted, Madden NFL 06, FIFA 06, and The Sims 2.
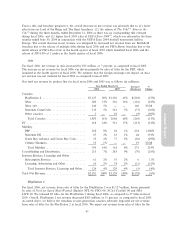
Net income for the Ñscal year ended March 31, 2006 was $236 million as compared to $504 million for
Annual Report
the Ñscal year ended March 31, 2005. Diluted net income per share for the Ñscal year ended March 31,
2006 was $0.75 as compared to $1.59 for the Ñscal year ended March 31, 2005.
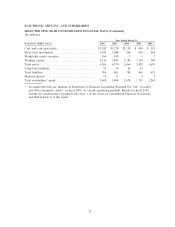
We generated $596 million in cash from operating activities during the year ended March 31, 2006 as
compared to generating $634 million for year ended March 31, 2005. The decrease in cash generated from
operating activities was primarily due to a decrease in our net revenue and an increase in our operating
expenses primarily to support the development of next-generation console games. This decrease was
partially oÅset by a lower accounts receivable balance as of March 31, 2006 compared to March 31, 2005,
resulting from a higher percentage of revenue recognized in the Ñrst two months of our fourth quarter of
Ñscal 2006 as compared to the fourth quarter of Ñscal 2005, which allowed us to collect a higher
percentage of our revenue during the quarter.
Management's Overview of Historical and Prospective Business Trends
Transition to Next-Generation Consoles. Our industry is cyclical and in the midst of a transition stage
heading into the next cycle. During the three months ended December 31, 2005, Microsoft launched the
Xbox 360, and Sony and Nintendo have both announced their intention to introduce new video game
consoles in the coming months. We expect that, as the current generation of consoles continue to progress
33