Electronic Arts 2006 Annual Report Download - page 147
Download and view the complete annual report
Please find page 147 of the 2006 Electronic Arts annual report below. You can navigate through the pages in the report by either clicking on the pages listed below, or by using the keyword search tool below to find specific information within the annual report.-
 1
1 -
2
-
3
-
4
-
5
-
6
-
7
-
8
-
9
-
10
-
11
-
12
-
13
-
14
-
15
-
16
-
17
-
18
-
19
-
20
-
21
-
22
-
23
-
24
-
25
-
26
-
27
-
28
-
29
-
30
-
31
-
32
-
33
-
34
-
35
-
36
-
37
-
38
-
39
-
40
-
41
-
42
-
43
-
44
-
45
-
46
-
47
-
48
-
49
-
50
-
51
-
52
-
53
-
54
-
55
-
56
-
57
-
58
-
59
-
60
-
61
-
62
-
63
-
64
-
65
-
66
-
67
-
68
-
69
-
70
-
71
-
72
-
73
-
74
-
75
-
76
-
77
-
78
-
79
-
80
-
81
-
82
-
83
-
84
-
85
-
86
-
87
-
88
-
89
-
90
-
91
-
92
-
93
-
94
-
95
-
96
-
97
-
98
-
99
-
100
-
101
-
102
-
103
-
104
-
105
-
106
-
107
-
108
-
109
-
110
-
111
-
112
-
113
-
114
-
115
-
116
-
117
-
118
-
119
-
120
-
121
-
122
-
123
-
124
-
125
-
126
-
127
-
128
-
129
-
130
-
131
-
132
-
133
-
134
-
135
-
136
-
 137
137 -
 138
138 -
 139
139 -
 140
140 -
 141
141 -
 142
142 -
 143
143 -
 144
144 -
 145
145 -
 146
146 -
 147
147 -
 148
148 -
 149
149 -
 150
150 -
 151
151 -
 152
152 -
 153
153 -
 154
154 -
 155
155 -
 156
156 -
 157
157 -
158
-
159
-
160
-
161
-
162
-
163
-
164
-
165
-
166
-
167
-
168
-
169
-
170
-
171
-
172
-
173
-
174
-
175
-
176
-
177
-
178
-
179
-
180
-
181
-
182
-
183
-
184
-
185
-
186
-
187
-
188
-
189
-
190
-
191
-
192
-
193
-
194
-
195
-
196
 |
 |

(l) Sales Returns and Allowances and Bad Debt Reserves
We estimate potential future product returns, price protection and stock-balancing programs related to
current-period product revenue. We analyze historical returns, current sell-through of distributor and
retailer inventory of our products, current trends in the video game market and the overall economy,
changes in customer demand and acceptance of our products and other related factors when evaluating the
adequacy of the sales returns and price protection allowances. In addition, we monitor the volume of sales
to our channel partners and their inventories as substantial overstocking in the distribution channel could
result in high returns or higher price protection costs in subsequent periods.
Similarly, signiÑcant judgment is required to estimate our allowance for doubtful accounts in any
accounting period. We analyze customer concentrations, customer credit-worthiness, current economic
trends, and historical experience when evaluating the adequacy of the allowance for doubtful accounts.
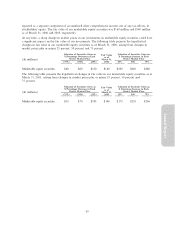
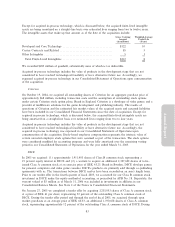
(m) Advertising Costs
We generally expense advertising costs as incurred, except for production costs associated with media
campaigns which are recognized as prepaid assets (to the extent paid in advance) and expensed at the Ñrst
run of the advertisement. Cooperative advertising with our channel partners is accrued when revenue is
recognized and such amounts are included in marketing and sales expense if there is a separate identiÑable
beneÑt for which we can reasonably estimate the fair value of the beneÑt identiÑed. Otherwise, they are
recognized as a reduction of net revenue. We then reimburse the channel partner when qualifying claims
are submitted. We sometimes receive reimbursements for advertising costs from our vendors, and such
amounts are recognized as a reduction of marketing and sales expense if the advertising (1) is speciÑc to
the vendor, (2) represents an identiÑable beneÑt to us and (3) represents an incremental cost to us.
Otherwise, vendor reimbursements are recognized as a reduction of cost of goods sold as the related
revenue is recognized. Vendor reimbursements of advertising expenses of $41 million, $42 million and
$45 million reduced marketing and sales expense for the Ñscal years ended March 31, 2006, 2005 and
2004, respectively. For the Ñscal years ended March 31, 2006, 2005 and 2004, advertising expenses, net of
vendor reimbursements, totaled approximately $180 million, $174 million and $183 million, respectively.
(n) Software Development Costs
Research and development costs, which consist primarily of software development costs, are expensed as
incurred. SFAS No. 86, ""Accounting for the Cost of Computer Software to be Sold, Leased, or Otherwise
Annual Report
Marketed'', provides for the capitalization of certain software development costs incurred after
technological feasibility of the software is established or for development costs that have alternative future
uses. Under our current practice of developing new products, the technological feasibility of the underlying
software is not established until substantially all product development is complete, which generally includes
the development of a working model. The software development costs that have been capitalized to date
have been insigniÑcant.
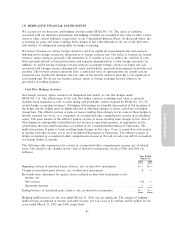
(o) Stock-based Compensation
We account for stock-based awards to employees using the intrinsic value method in accordance with APB
No. 25, ""Accounting for Stock Issued to Employees''. We have adopted the disclosure-only provisions of
SFAS No. 123, ""Accounting for Stock-Based Compensation'', as amended.
Had compensation cost for our stock-based compensation plans been measured based on the estimated fair
value at the grant dates in accordance with the provisions of SFAS No. 123, as amended, we estimate that
our reported net income and net income per share would have been the pro forma amounts indicated
below. The fair value of each option grant is estimated on the date of grant using the Black-Scholes
75