Electronic Arts 2006 Annual Report Download - page 175
Download and view the complete annual report
Please find page 175 of the 2006 Electronic Arts annual report below. You can navigate through the pages in the report by either clicking on the pages listed below, or by using the keyword search tool below to find specific information within the annual report.-
 1
1 -
2
-
3
-
4
-
5
-
6
-
7
-
8
-
9
-
10
-
11
-
12
-
13
-
14
-
15
-
16
-
17
-
18
-
19
-
20
-
21
-
22
-
23
-
24
-
25
-
26
-
27
-
28
-
29
-
30
-
31
-
32
-
33
-
34
-
35
-
36
-
37
-
38
-
39
-
40
-
41
-
42
-
43
-
44
-
45
-
46
-
47
-
48
-
49
-
50
-
51
-
52
-
53
-
54
-
55
-
56
-
57
-
58
-
59
-
60
-
61
-
62
-
63
-
64
-
65
-
66
-
67
-
68
-
69
-
70
-
71
-
72
-
73
-
74
-
75
-
76
-
77
-
78
-
79
-
80
-
81
-
82
-
83
-
84
-
85
-
86
-
87
-
88
-
89
-
90
-
91
-
92
-
93
-
94
-
95
-
96
-
97
-
98
-
99
-
100
-
101
-
102
-
103
-
104
-
105
-
106
-
107
-
108
-
109
-
110
-
111
-
112
-
113
-
114
-
115
-
116
-
117
-
118
-
119
-
120
-
121
-
122
-
123
-
124
-
125
-
126
-
127
-
128
-
129
-
130
-
131
-
132
-
133
-
134
-
135
-
136
-
137
-
138
-
139
-
140
-
141
-
142
-
143
-
144
-
145
-
146
-
147
-
148
-
149
-
150
-
151
-
152
-
153
-
154
-
155
-
156
-
157
-
158
-
159
-
160
-
161
-
162
-
163
-
164
-
 165
165 -
 166
166 -
 167
167 -
 168
168 -
 169
169 -
 170
170 -
 171
171 -
 172
172 -
 173
173 -
 174
174 -
 175
175 -
 176
176 -
 177
177 -
 178
178 -
 179
179 -
 180
180 -
 181
181 -
 182
182 -
 183
183 -
 184
184 -
 185
185 -
186
-
187
-
188
-
189
-
190
-
191
-
192
-
193
-
194
-
195
-
196
 |
 |

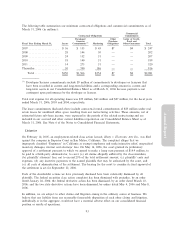
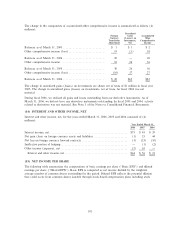
options, restricted stock unit awards, warrants and other convertible securities using the treasury stock
method.
Year Ended March 31,
2006 2005 2004
(In millions, except per share amounts)
Net income ÏÏÏÏÏÏÏÏÏÏÏÏÏÏÏÏÏÏÏÏÏÏÏÏÏÏÏÏÏÏÏÏÏÏÏÏÏÏÏÏÏÏÏÏÏÏÏÏÏÏÏÏÏÏÏÏÏÏÏ $ 236 $ 504 $ 577
Shares used to compute net income per share:
Weighted-average common stock outstanding Ì basicÏÏÏÏÏÏÏÏÏÏÏÏÏÏÏÏÏÏÏÏÏÏ 304 305 295
Dilutive potential common sharesÏÏÏÏÏÏÏÏÏÏÏÏÏÏÏÏÏÏÏÏÏÏÏÏÏÏÏÏÏÏÏÏÏÏÏÏÏÏÏ 10 13 13
Weighted-average common stock outstanding Ì diluted ÏÏÏÏÏÏÏÏÏÏÏÏÏÏÏÏÏÏÏÏ 314 318 308
Net income per share:
BasicÏÏÏÏÏÏÏÏÏÏÏÏÏÏÏÏÏÏÏÏÏÏÏÏÏÏÏÏÏÏÏÏÏÏÏÏÏÏÏÏÏÏÏÏÏÏÏÏÏÏÏÏÏÏÏÏÏÏÏÏÏÏÏ $0.78 $1.65 $1.95
Diluted ÏÏÏÏÏÏÏÏÏÏÏÏÏÏÏÏÏÏÏÏÏÏÏÏÏÏÏÏÏÏÏÏÏÏÏÏÏÏÏÏÏÏÏÏÏÏÏÏÏÏÏÏÏÏÏÏÏÏÏÏÏ $0.75 $1.59 $1.87
Options to purchase 7 million, 1 million and 3 million shares of common stock were excluded from the
above computation of weighted-average common stock for Diluted EPS for the Ñscal years ended
March 31, 2006, 2005 and 2004, respectively, as the options' exercise price was greater than the average
market price of the common stock. For Ñscal 2006, 2005 and 2004, the weighted-average exercise price of
these options was $63.34, $63.63 and $47.19 per share, respectively.
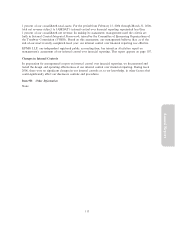
(16) RELATED PARTY TRANSACTIONS
On June 24, 2002, we hired Warren Jenson as our Chief Financial and Administrative OÇcer and agreed
to loan him $4 million to be forgiven over four years based on his continuing employment. The loan does
not bear interest. On June 24, 2004, pursuant to the terms of the loan agreement, we forgave $2 million of
the loan and provided Mr. Jenson approximately $1.6 million to oÅset the tax implications of the
forgiveness. As of March 31, 2006, the remaining outstanding loan balance was $2 million, which will be
forgiven on June 24, 2006, provided that Mr. Jenson has not voluntarily resigned his employment with us
or been terminated for cause prior to that time. No additional funds will be provided to oÅset the tax
implications of the forgiveness of the remaining $2 million.
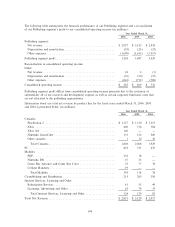
(17) SEGMENT INFORMATION
Annual Report
Our reporting segments are based upon: our internal organizational structure; the manner in which our
operations are managed; the criteria used by our Chief Executive OÇcer, our chief operating decision
maker, to evaluate segment performance; the availability of separate Ñnancial information; and overall
materiality considerations.
We manage our business primarily based on geographical performance. Accordingly, our combined global
publishing organizations represent our reportable segment, our Publishing segment, due to their similar
economic characteristics, products and distribution methods. Publishing refers to the manufacturing,
marketing, advertising and distribution of products developed or co-developed by us, or distribution of
certain third-party publishers' products through our co-publishing and distribution program.
103