Electronic Arts 2006 Annual Report Download - page 121
Download and view the complete annual report
Please find page 121 of the 2006 Electronic Arts annual report below. You can navigate through the pages in the report by either clicking on the pages listed below, or by using the keyword search tool below to find specific information within the annual report.-
 1
1 -
2
-
3
-
4
-
5
-
6
-
7
-
8
-
9
-
10
-
11
-
12
-
13
-
14
-
15
-
16
-
17
-
18
-
19
-
20
-
21
-
22
-
23
-
24
-
25
-
26
-
27
-
28
-
29
-
30
-
31
-
32
-
33
-
34
-
35
-
36
-
37
-
38
-
39
-
40
-
41
-
42
-
43
-
44
-
45
-
46
-
47
-
48
-
49
-
50
-
51
-
52
-
53
-
54
-
55
-
56
-
57
-
58
-
59
-
60
-
61
-
62
-
63
-
64
-
65
-
66
-
67
-
68
-
69
-
70
-
71
-
72
-
73
-
74
-
75
-
76
-
77
-
78
-
79
-
80
-
81
-
82
-
83
-
84
-
85
-
86
-
87
-
88
-
89
-
90
-
91
-
92
-
93
-
94
-
95
-
96
-
97
-
98
-
99
-
100
-
101
-
102
-
103
-
104
-
105
-
106
-
107
-
108
-
109
-
110
-
 111
111 -
 112
112 -
 113
113 -
 114
114 -
 115
115 -
 116
116 -
 117
117 -
 118
118 -
 119
119 -
 120
120 -
 121
121 -
 122
122 -
 123
123 -
 124
124 -
 125
125 -
 126
126 -
 127
127 -
 128
128 -
 129
129 -
 130
130 -
 131
131 -
132
-
133
-
134
-
135
-
136
-
137
-
138
-
139
-
140
-
141
-
142
-
143
-
144
-
145
-
146
-
147
-
148
-
149
-
150
-
151
-
152
-
153
-
154
-
155
-
156
-
157
-
158
-
159
-
160
-
161
-
162
-
163
-
164
-
165
-
166
-
167
-
168
-
169
-
170
-
171
-
172
-
173
-
174
-
175
-
176
-
177
-
178
-
179
-
180
-
181
-
182
-
183
-
184
-
185
-
186
-
187
-
188
-
189
-
190
-
191
-
192
-
193
-
194
-
195
-
196
 |
 |

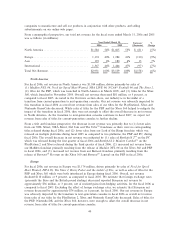
March 31, 2005. Excluding the eÅect of foreign exchange rates, we estimate that Asia net revenue
increased by approximately $4 million, or 3 percent, for the Ñscal year ended March 31, 2005.
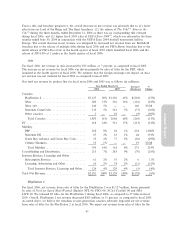
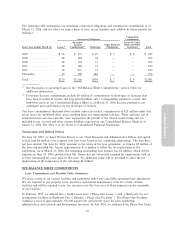
Our total net revenue by product line for Ñscal years 2005 and 2004 was as follows (in millions):
Year Ended March 31, Increase/ %
2005 2004 (Decrease) Change
Consoles
PlayStation 2ÏÏÏÏÏÏÏÏÏÏÏÏÏÏÏÏÏÏÏÏÏÏÏÏÏÏÏÏÏÏÏ $1,330 43% $1,315 44% $ 15 1%
Xbox ÏÏÏÏÏÏÏÏÏÏÏÏÏÏÏÏÏÏÏÏÏÏÏÏÏÏÏÏÏÏÏÏÏÏÏÏÏ 516 16% 384 13% 132 34%
Nintendo GameCubeÏÏÏÏÏÏÏÏÏÏÏÏÏÏÏÏÏÏÏÏÏÏÏÏ 212 7% 200 7% 12 6%
Other consoles ÏÏÏÏÏÏÏÏÏÏÏÏÏÏÏÏÏÏÏÏÏÏÏÏÏÏÏÏÏ 10 Ì 30 1% (20) (67%)
Total Consoles ÏÏÏÏÏÏÏÏÏÏÏÏÏÏÏÏÏÏÏÏÏÏÏÏÏÏÏ 2,068 66% 1,929 65% 139 7%
PC ÏÏÏÏÏÏÏÏÏÏÏÏÏÏÏÏÏÏÏÏÏÏÏÏÏÏÏÏÏÏÏÏÏÏÏÏÏÏÏÏÏ 531 17% 470 16% 61 13%
Mobility
Game Boy Advance and Game Boy Color ÏÏÏÏÏÏ 77 2% 78 3% (1) (1%)
Nintendo DSÏÏÏÏÏÏÏÏÏÏÏÏÏÏÏÏÏÏÏÏÏÏÏÏÏÏÏÏÏÏÏ 23 1% Ì Ì 23 N/M
PSP ÏÏÏÏÏÏÏÏÏÏÏÏÏÏÏÏÏÏÏÏÏÏÏÏÏÏÏÏÏÏÏÏÏÏÏÏÏÏ 18 1% Ì Ì 18 N/M
Total MobilityÏÏÏÏÏÏÏÏÏÏÏÏÏÏÏÏÏÏÏÏÏÏÏÏÏÏÏÏ 118 4% 78 3% 40 51%
Co-publishing and DistributionÏÏÏÏÏÏÏÏÏÏÏÏÏÏÏÏÏÏ 283 9% 398 13% (115) (29%)
Internet Services, Licensing and Other
Subscription Services ÏÏÏÏÏÏÏÏÏÏÏÏÏÏÏÏÏÏÏÏÏÏÏÏ 55 2% 49 2% 6 12%
Licensing, Advertising and OtherÏÏÏÏÏÏÏÏÏÏÏÏÏÏ 74 2% 33 1% 41 124%
Total Internet Services, Licensing and Other ÏÏ 129 4% 82 3% 47 57%
Total Net RevenueÏÏÏÏÏÏÏÏÏÏÏÏÏÏÏÏÏÏÏÏÏÏÏÏÏÏÏÏ $3,129 100% $2,957 100% $ 172 6%
PlayStation 2
Net revenue from PlayStation 2 products increased from $1,315 million in Ñscal 2004 to $1,330 million in
Ñscal 2005. As a percentage of total net revenue, sales of PlayStation 2 products decreased by 1 percent in
Ñscal 2005.
Annual Report
Xbox
Net revenue from Xbox products increased from $384 million in Ñscal 2004 to $516 million in Ñscal 2005.
As a percentage of total net revenue, sales of Xbox products increased by 3 percent in Ñscal 2005. The
increase in net revenue was primarily due to the continued growth in the Xbox installed base driven by
Microsoft's price reductions in the U.S. in March 2004 and in Europe in August 2004, as well as the
overall greater demand for our products.
Nintendo GameCube
Net revenue from Nintendo GameCube products increased from $200 million in Ñscal 2004 to
$212 million in Ñscal 2005. The increase in net revenue was primarily due to growth in the installed base
of the Nintendo GameCube.
PC
Net revenue from PC-based products increased from $470 million in Ñscal 2004 to $531 million in Ñscal
2005. As a percentage of total net revenue, sales of PC products increased by 1 percent in Ñscal 2005. The
49