Electronic Arts 2006 Annual Report Download - page 127
Download and view the complete annual report
Please find page 127 of the 2006 Electronic Arts annual report below. You can navigate through the pages in the report by either clicking on the pages listed below, or by using the keyword search tool below to find specific information within the annual report.-
 1
1 -
2
-
3
-
4
-
5
-
6
-
7
-
8
-
9
-
10
-
11
-
12
-
13
-
14
-
15
-
16
-
17
-
18
-
19
-
20
-
21
-
22
-
23
-
24
-
25
-
26
-
27
-
28
-
29
-
30
-
31
-
32
-
33
-
34
-
35
-
36
-
37
-
38
-
39
-
40
-
41
-
42
-
43
-
44
-
45
-
46
-
47
-
48
-
49
-
50
-
51
-
52
-
53
-
54
-
55
-
56
-
57
-
58
-
59
-
60
-
61
-
62
-
63
-
64
-
65
-
66
-
67
-
68
-
69
-
70
-
71
-
72
-
73
-
74
-
75
-
76
-
77
-
78
-
79
-
80
-
81
-
82
-
83
-
84
-
85
-
86
-
87
-
88
-
89
-
90
-
91
-
92
-
93
-
94
-
95
-
96
-
97
-
98
-
99
-
100
-
101
-
102
-
103
-
104
-
105
-
106
-
107
-
108
-
109
-
110
-
111
-
112
-
113
-
114
-
115
-
116
-
 117
117 -
 118
118 -
 119
119 -
 120
120 -
 121
121 -
 122
122 -
 123
123 -
 124
124 -
 125
125 -
 126
126 -
 127
127 -
 128
128 -
 129
129 -
 130
130 -
 131
131 -
 132
132 -
 133
133 -
 134
134 -
 135
135 -
 136
136 -
 137
137 -
138
-
139
-
140
-
141
-
142
-
143
-
144
-
145
-
146
-
147
-
148
-
149
-
150
-
151
-
152
-
153
-
154
-
155
-
156
-
157
-
158
-
159
-
160
-
161
-
162
-
163
-
164
-
165
-
166
-
167
-
168
-
169
-
170
-
171
-
172
-
173
-
174
-
175
-
176
-
177
-
178
-
179
-
180
-
181
-
182
-
183
-
184
-
185
-
186
-
187
-
188
-
189
-
190
-
191
-
192
-
193
-
194
-
195
-
196
 |
 |

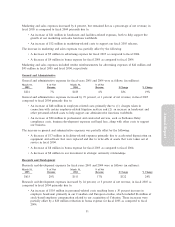
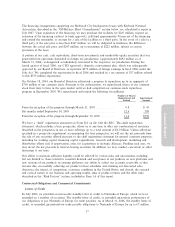
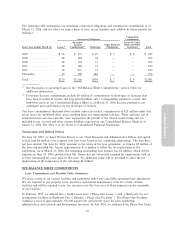
Year Ended
March 31, March 31, Increase/
2006 2005 (Decrease)
(In millions)
Cash provided by operating activities ÏÏÏÏÏÏÏÏÏÏÏÏÏÏÏÏÏÏÏÏÏÏÏÏÏÏÏÏÏ $ 596 $ 634 $ (38)
Cash used in investing activitiesÏÏÏÏÏÏÏÏÏÏÏÏÏÏÏÏÏÏÏÏÏÏÏÏÏÏÏÏÏÏÏÏÏÏ (108) (1,726) 1,618
Cash provided by (used in) Ñnancing activities ÏÏÏÏÏÏÏÏÏÏÏÏÏÏÏÏÏÏÏÏÏ (503) 200 (703)
EÅect of foreign exchange on cash and cash equivalents ÏÏÏÏÏÏÏÏÏÏÏÏÏ (13) 12 (25)
Net decrease in cash and cash equivalents ÏÏÏÏÏÏÏÏÏÏÏÏÏÏÏÏÏÏÏÏÏÏÏÏÏ $ (28) $ (880) $ 852
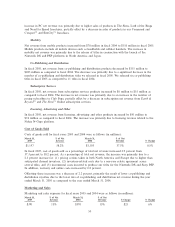
Changes in Cash Flow
During Ñscal 2006, we generated $596 million of cash from operating activities as compared to
$634 million for Ñscal 2005. The decrease in cash generated from operating activities was primarily due to
our overall decline in net income resulting from a decrease in net revenue and an increase in operating
expenses primarily to support the development of titles for next-generation consoles. This decrease was
partially oÅset by a lower accounts receivable balance as of March 31, 2006 as compared to March 31,
2005, resulting from a higher percentage of net revenue recognized in the Ñrst two months of our fourth
quarter of Ñscal 2006 as compared to the fourth quarter of Ñscal 2005, which allowed us to collect a higher
percentage of our receivables prior to the end of the quarter. We expect cash from operating activities to
decline in Ñscal 2007.
For Ñscal 2006, our primary use of cash in non-operating activities consisted of $755 million used to
purchase short-term investments, $709 million used to repurchase and retire a portion of our common
stock, $661 million used primarily for our acquisition of JAMDAT, and $123 million in capital
expenditures primarily related to the expansion of our Vancouver studio and investments in our worldwide
development tools, technologies and equipment. These non-operating expenditures were partially oÅset by
$1,427 million in proceeds from the maturities and sales of short-term investments and $206 million in
proceeds from sales of common stock through our employee stock plans and other plans. During Ñscal
2007, we anticipate making continued capital investments in our studios as well as investments in next-
generation consoles, online infrastructure and mobile platforms.
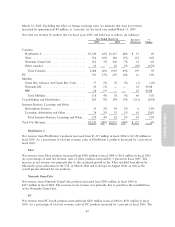
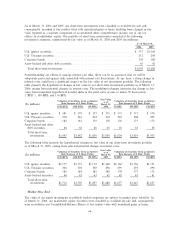
Short-term investments and marketable equity securities
As of March 31, 2006, our portfolio of cash, cash equivalents and short-term investments was comprised of
Annual Report
55 percent cash and cash equivalents and 45 percent short-term investments. As of March 31, 2005,
43 percent of our portfolio consisted of cash and cash equivalents and 57 percent of our portfolio consisted
of short-term investments. In absolute dollars, our cash and cash equivalents decreased from
$1,270 million as of March 31, 2005 to $1,242 million as of March 31, 2006. This decrease was primarily
due to our purchase of short-term investments, our acquisition of JAMDAT, and our common stock
repurchase program during the Ñrst six months of Ñscal 2006. These decreases were partially oÅset by
proceeds received from the maturities and sales of short-term investments. Due to our mix of Ñxed and
variable rate securities, our short-term investment portfolio is susceptible to changes in short-term interest
rates. As of March 31, 2006, our short-term investments included gross unrealized losses of approximately
$7 million, or less than 1 percent of the total in short-term investments. From time to time, we may
liquidate some or all of our short-term investments to fund operational needs or other activities, such as
capital expenditures, business acquisitions or stock repurchase programs. Depending on which short-term
investments we liquidate to fund these activities, we could recognize a portion of the gross unrealized
losses.
Marketable equity securities increased to $160 million as of March 31, 2006, from $140 million as of
March 31, 2005, primarily due to an increase in the unrealized gain on our investment in Ubisoft
Entertainment.
55