Electronic Arts 2006 Annual Report Download - page 123
Download and view the complete annual report
Please find page 123 of the 2006 Electronic Arts annual report below. You can navigate through the pages in the report by either clicking on the pages listed below, or by using the keyword search tool below to find specific information within the annual report.-
 1
1 -
2
-
3
-
4
-
5
-
6
-
7
-
8
-
9
-
10
-
11
-
12
-
13
-
14
-
15
-
16
-
17
-
18
-
19
-
20
-
21
-
22
-
23
-
24
-
25
-
26
-
27
-
28
-
29
-
30
-
31
-
32
-
33
-
34
-
35
-
36
-
37
-
38
-
39
-
40
-
41
-
42
-
43
-
44
-
45
-
46
-
47
-
48
-
49
-
50
-
51
-
52
-
53
-
54
-
55
-
56
-
57
-
58
-
59
-
60
-
61
-
62
-
63
-
64
-
65
-
66
-
67
-
68
-
69
-
70
-
71
-
72
-
73
-
74
-
75
-
76
-
77
-
78
-
79
-
80
-
81
-
82
-
83
-
84
-
85
-
86
-
87
-
88
-
89
-
90
-
91
-
92
-
93
-
94
-
95
-
96
-
97
-
98
-
99
-
100
-
101
-
102
-
103
-
104
-
105
-
106
-
107
-
108
-
109
-
110
-
111
-
112
-
 113
113 -
 114
114 -
 115
115 -
 116
116 -
 117
117 -
 118
118 -
 119
119 -
 120
120 -
 121
121 -
 122
122 -
 123
123 -
 124
124 -
 125
125 -
 126
126 -
 127
127 -
 128
128 -
 129
129 -
 130
130 -
 131
131 -
 132
132 -
 133
133 -
134
-
135
-
136
-
137
-
138
-
139
-
140
-
141
-
142
-
143
-
144
-
145
-
146
-
147
-
148
-
149
-
150
-
151
-
152
-
153
-
154
-
155
-
156
-
157
-
158
-
159
-
160
-
161
-
162
-
163
-
164
-
165
-
166
-
167
-
168
-
169
-
170
-
171
-
172
-
173
-
174
-
175
-
176
-
177
-
178
-
179
-
180
-
181
-
182
-
183
-
184
-
185
-
186
-
187
-
188
-
189
-
190
-
191
-
192
-
193
-
194
-
195
-
196
 |
 |

Marketing and sales expenses increased by 6 percent, but remained Öat as a percentage of net revenue, in
Ñscal 2005 as compared to Ñscal 2004 primarily due to:
‚ An increase of $21 million in headcount and facilities-related expenses, both to help support the
growth of our marketing and sales functions worldwide.
‚ An increase of $12 million in marketing-related costs to support our Ñscal 2005 releases.
The increase in marketing and sales expenses was partially oÅset by the following:
‚ A decrease of $9 million in advertising expense for Ñscal 2005 as compared to Ñscal 2004.
‚ A decrease of $4 million in bonus expense for Ñscal 2005 as compared to Ñscal 2004.
Marketing and sales expenses included vendor reimbursements for advertising expenses of $42 million and
$45 million in Ñscal 2005 and Ñscal 2004, respectively.
General and Administrative
General and administrative expenses for Ñscal years 2005 and 2004 were as follows (in millions):
March 31, % of Net March 31, % of Net
2005 Revenue 2004 Revenue $ Change % Change
$221 7% $185 6% $36 19%
General and administrative expenses increased by 19 percent, or 1 percent of net revenue, in Ñscal 2005
compared to Ñscal 2004 primarily due to:
‚ An increase of $48 million in employee-related costs primarily due to (1) charges taken in
connection with certain employee-related litigation matters and (2) an increase in headcount and
other personnel-related costs to help support our administrative functions worldwide.
‚ An increase of $20 million in professional and contracted services, such as Sarbanes-Oxley
compliance costs, business development expenses and legal fees, along with other costs to support
our business.
The increase in general and administrative expenses was partially oÅset by the following:
‚ A decrease of $17 million in facilities-related expenses primarily due to accelerated depreciation on
equipment and software that were replaced and due to write-oÅs of assets that were taken out of
service in Ñscal 2004.
Annual Report
‚ A decrease of $8 million in bonus expense for Ñscal 2005 as compared to Ñscal 2004.
‚ A decrease of $8 million in our investment in strategic university relationships.
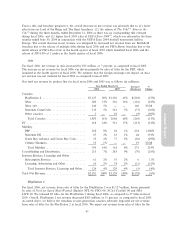
Research and Development
Research and development expenses for Ñscal years 2005 and 2004 were as follows (in millions):
March 31, % of Net March 31, % of Net
2005 Revenue 2004 Revenue $ Change % Change
$633 20% $511 17% $122 24%
Research and development expenses increased by 24 percent, or 3 percent of net revenue, in Ñscal 2005 as
compared to Ñscal 2004 primarily due to:
‚ An increase of $103 million in personnel-related costs resulting from a 30 percent increase in
employee headcount primarily in our Canadian and European studios, which included $6 million of
stock-based employee compensation related to our acquisition of Criterion. These increases were
partially oÅset by a $20 million reduction in bonus expense for Ñscal 2005 as compared to Ñscal
2004.
51