Electronic Arts 2006 Annual Report Download - page 177
Download and view the complete annual report
Please find page 177 of the 2006 Electronic Arts annual report below. You can navigate through the pages in the report by either clicking on the pages listed below, or by using the keyword search tool below to find specific information within the annual report.-
 1
1 -
2
-
3
-
4
-
5
-
6
-
7
-
8
-
9
-
10
-
11
-
12
-
13
-
14
-
15
-
16
-
17
-
18
-
19
-
20
-
21
-
22
-
23
-
24
-
25
-
26
-
27
-
28
-
29
-
30
-
31
-
32
-
33
-
34
-
35
-
36
-
37
-
38
-
39
-
40
-
41
-
42
-
43
-
44
-
45
-
46
-
47
-
48
-
49
-
50
-
51
-
52
-
53
-
54
-
55
-
56
-
57
-
58
-
59
-
60
-
61
-
62
-
63
-
64
-
65
-
66
-
67
-
68
-
69
-
70
-
71
-
72
-
73
-
74
-
75
-
76
-
77
-
78
-
79
-
80
-
81
-
82
-
83
-
84
-
85
-
86
-
87
-
88
-
89
-
90
-
91
-
92
-
93
-
94
-
95
-
96
-
97
-
98
-
99
-
100
-
101
-
102
-
103
-
104
-
105
-
106
-
107
-
108
-
109
-
110
-
111
-
112
-
113
-
114
-
115
-
116
-
117
-
118
-
119
-
120
-
121
-
122
-
123
-
124
-
125
-
126
-
127
-
128
-
129
-
130
-
131
-
132
-
133
-
134
-
135
-
136
-
137
-
138
-
139
-
140
-
141
-
142
-
143
-
144
-
145
-
146
-
147
-
148
-
149
-
150
-
151
-
152
-
153
-
154
-
155
-
156
-
157
-
158
-
159
-
160
-
161
-
162
-
163
-
164
-
165
-
166
-
 167
167 -
 168
168 -
 169
169 -
 170
170 -
 171
171 -
 172
172 -
 173
173 -
 174
174 -
 175
175 -
 176
176 -
 177
177 -
 178
178 -
 179
179 -
 180
180 -
 181
181 -
 182
182 -
 183
183 -
 184
184 -
 185
185 -
 186
186 -
 187
187 -
188
-
189
-
190
-
191
-
192
-
193
-
194
-
195
-
196
 |
 |

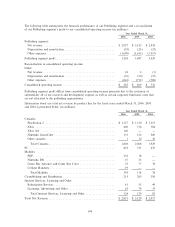
Information about our operations in North America, Europe and Asia for the Ñscal years ended March 31,
2006, 2005 and 2004 is presented below (in millions):
North
America Europe Asia Total
Year ended March 31, 2006
Net revenue from unaÇliated customers ÏÏÏÏÏÏÏÏÏÏÏÏÏÏÏÏÏÏÏÏÏÏÏÏÏ $1,584 $1,174 $193 $2,951
Long-lived assetsÏÏÏÏÏÏÏÏÏÏÏÏÏÏÏÏÏÏÏÏÏÏÏÏÏÏÏÏÏÏÏÏÏÏÏÏÏÏÏÏÏÏÏÏÏ 1,061 203 7 1,271
Year ended March 31, 2005
Net revenue from unaÇliated customers ÏÏÏÏÏÏÏÏÏÏÏÏÏÏÏÏÏÏÏÏÏÏÏÏÏ $1,665 $1,284 $180 $3,129
Long-lived assetsÏÏÏÏÏÏÏÏÏÏÏÏÏÏÏÏÏÏÏÏÏÏÏÏÏÏÏÏÏÏÏÏÏÏÏÏÏÏÏÏÏÏÏÏÏ 314 218 10 542
Year ended March 31, 2004
Net revenue from unaÇliated customers ÏÏÏÏÏÏÏÏÏÏÏÏÏÏÏÏÏÏÏÏÏÏÏÏÏ $1,610 $1,180 $167 $2,957
Long-lived assetsÏÏÏÏÏÏÏÏÏÏÏÏÏÏÏÏÏÏÏÏÏÏÏÏÏÏÏÏÏÏÏÏÏÏÏÏÏÏÏÏÏÏÏÏÏ 259 143 6 408
Our direct sales to Wal-Mart Stores, Inc. represented approximately 13 percent of total net revenue in
both Ñscal 2006 and 2004 and approximately 14 percent of total net revenue in Ñscal 2005.
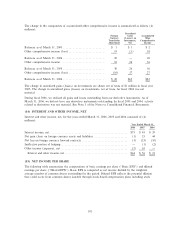
(18) QUARTERLY FINANCIAL AND MARKET INFORMATION (UNAUDITED)
Quarter Ended Year
June 30 Sept. 30 Dec. 31 March 31 Ended
(In millions, except per share data)
Fiscal 2006 Consolidated
Net revenue ÏÏÏÏÏÏÏÏÏÏÏÏÏÏÏÏÏÏÏÏÏÏÏÏÏÏÏÏÏÏÏÏÏÏÏÏÏ $ 365 $ 675 $1,270 $ 641 $2,951
Gross proÑt ÏÏÏÏÏÏÏÏÏÏÏÏÏÏÏÏÏÏÏÏÏÏÏÏÏÏÏÏÏÏÏÏÏÏÏÏÏÏ 214 391 768 397 1,770
Operating income (loss) ÏÏÏÏÏÏÏÏÏÏÏÏÏÏÏÏÏÏÏÏÏÏÏÏÏÏÏ (96) 49 347 25 325
Net income (loss) ÏÏÏÏÏÏÏÏÏÏÏÏÏÏÏÏÏÏÏÏÏÏÏÏÏÏÏÏÏÏÏÏ (58)(a) 51(b) 259(c) (16)(d) 236
Common Stock
Net income (loss) per share Ì basic ÏÏÏÏÏÏÏÏÏÏÏÏÏÏÏÏ $(0.19) $ 0.17 $ 0.86 $(0.05) $ 0.78
Net income (loss) per share Ì diluted ÏÏÏÏÏÏÏÏÏÏÏÏÏÏÏ $(0.19) $ 0.16 $ 0.83 $(0.05) $ 0.75
Common stock price per share
HighÏÏÏÏÏÏÏÏÏÏÏÏÏÏÏÏÏÏÏÏÏÏÏÏÏÏÏÏÏÏÏÏÏÏÏÏÏÏÏÏÏÏ $59.83 $63.12 $61.97 $58.59 $63.12
Low ÏÏÏÏÏÏÏÏÏÏÏÏÏÏÏÏÏÏÏÏÏÏÏÏÏÏÏÏÏÏÏÏÏÏÏÏÏÏÏÏÏÏ $47.45 $55.22 $51.04 $50.14 $47.45
Annual Report
Fiscal 2005 Consolidated
Net revenue ÏÏÏÏÏÏÏÏÏÏÏÏÏÏÏÏÏÏÏÏÏÏÏÏÏÏÏÏÏÏÏÏÏÏÏÏÏ $ 432 $ 716 $1,428 $ 553 $3,129
Gross proÑt ÏÏÏÏÏÏÏÏÏÏÏÏÏÏÏÏÏÏÏÏÏÏÏÏÏÏÏÏÏÏÏÏÏÏÏÏÏÏ 255 432 925 320 1,932
Operating income ÏÏÏÏÏÏÏÏÏÏÏÏÏÏÏÏÏÏÏÏÏÏÏÏÏÏÏÏÏÏÏÏÏ 25 125 519 Ì 669
Net income ÏÏÏÏÏÏÏÏÏÏÏÏÏÏÏÏÏÏÏÏÏÏÏÏÏÏÏÏÏÏÏÏÏÏÏÏÏÏ 24 97 375(e) 8(f) 504
Common Stock
Net income per share Ì basic ÏÏÏÏÏÏÏÏÏÏÏÏÏÏÏÏÏÏÏÏÏÏ $ 0.08 $ 0.32 $ 1.23 $ 0.02 $ 1.65
Net income per share Ì dilutedÏÏÏÏÏÏÏÏÏÏÏÏÏÏÏÏÏÏÏÏÏ $ 0.08 $ 0.31 $ 1.18 $ 0.02 $ 1.59
Common stock price per share
HighÏÏÏÏÏÏÏÏÏÏÏÏÏÏÏÏÏÏÏÏÏÏÏÏÏÏÏÏÏÏÏÏÏÏÏÏÏÏÏÏÏÏ $55.91 $55.01 $62.86 $71.16 $71.16
Low ÏÏÏÏÏÏÏÏÏÏÏÏÏÏÏÏÏÏÏÏÏÏÏÏÏÏÏÏÏÏÏÏÏÏÏÏÏÏÏÏÏÏ $47.42 $45.52 $43.38 $54.52 $43.38
(a) Net income includes acquired in-process technology of $1 million, pre-tax.
105