Electronic Arts 2006 Annual Report Download - page 113
Download and view the complete annual report
Please find page 113 of the 2006 Electronic Arts annual report below. You can navigate through the pages in the report by either clicking on the pages listed below, or by using the keyword search tool below to find specific information within the annual report.-
 1
1 -
2
-
3
-
4
-
5
-
6
-
7
-
8
-
9
-
10
-
11
-
12
-
13
-
14
-
15
-
16
-
17
-
18
-
19
-
20
-
21
-
22
-
23
-
24
-
25
-
26
-
27
-
28
-
29
-
30
-
31
-
32
-
33
-
34
-
35
-
36
-
37
-
38
-
39
-
40
-
41
-
42
-
43
-
44
-
45
-
46
-
47
-
48
-
49
-
50
-
51
-
52
-
53
-
54
-
55
-
56
-
57
-
58
-
59
-
60
-
61
-
62
-
63
-
64
-
65
-
66
-
67
-
68
-
69
-
70
-
71
-
72
-
73
-
74
-
75
-
76
-
77
-
78
-
79
-
80
-
81
-
82
-
83
-
84
-
85
-
86
-
87
-
88
-
89
-
90
-
91
-
92
-
93
-
94
-
95
-
96
-
97
-
98
-
99
-
100
-
101
-
102
-
 103
103 -
 104
104 -
 105
105 -
 106
106 -
 107
107 -
 108
108 -
 109
109 -
 110
110 -
 111
111 -
 112
112 -
 113
113 -
 114
114 -
 115
115 -
 116
116 -
 117
117 -
 118
118 -
 119
119 -
 120
120 -
 121
121 -
 122
122 -
 123
123 -
124
-
125
-
126
-
127
-
128
-
129
-
130
-
131
-
132
-
133
-
134
-
135
-
136
-
137
-
138
-
139
-
140
-
141
-
142
-
143
-
144
-
145
-
146
-
147
-
148
-
149
-
150
-
151
-
152
-
153
-
154
-
155
-
156
-
157
-
158
-
159
-
160
-
161
-
162
-
163
-
164
-
165
-
166
-
167
-
168
-
169
-
170
-
171
-
172
-
173
-
174
-
175
-
176
-
177
-
178
-
179
-
180
-
181
-
182
-
183
-
184
-
185
-
186
-
187
-
188
-
189
-
190
-
191
-
192
-
193
-
194
-
195
-
196
 |
 |

From a title and franchise perspective, the overall decrease in net revenue was primarily due to (1) lower
sales from our Lord of the Rings and The Sims franchises, (2) the release of The Urbz
TM
: Sims in the
City
TM
during the three months ended December 31, 2004 as there was no corresponding title released
during Ñscal 2006, and (3) higher Ñscal 2005 sales of UEFA Euro 2004
TM
, which was released in the three
months ended June 30, 2004 in conjunction with the UEFA Euro 2004 football tournament held in
Europe. The overall decrease in net revenue was mitigated by increased net revenue from our BattleÑeld
franchise due to the release of multiple titles during Ñscal 2006 and our FIFA Street franchise due to the
initial release of FIFA Street late in the fourth quarter of Ñscal 2005 which beneÑted Ñscal 2006 and the
release of FIFA Street 2 earlier in the fourth quarter of Ñscal 2006.
Asia
For Ñscal 2006, net revenue in Asia increased by $13 million, or 7 percent, as compared to Ñscal 2005.
The increase in net revenue for Ñscal 2006 was driven primarily by sales of titles for the PSP, which
launched in the fourth quarter of Ñscal 2005. We estimate that the foreign exchange rate impact on Asia
net revenue was not material for Ñscal 2006 as compared to Ñscal 2005.
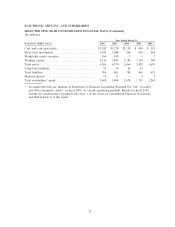
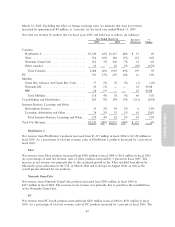
Our total net revenue by product line for Ñscal years 2006 and 2005 was as follows (in millions):
Year Ended March 31, Increase/ %
2006 2005 (Decrease) Change
Consoles
PlayStation 2ÏÏÏÏÏÏÏÏÏÏÏÏÏÏÏÏÏÏÏÏÏÏÏÏÏÏÏÏÏÏÏ $1,127 38% $1,330 43% $(203) (15%)
Xbox ÏÏÏÏÏÏÏÏÏÏÏÏÏÏÏÏÏÏÏÏÏÏÏÏÏÏÏÏÏÏÏÏÏÏÏÏÏ 400 13% 516 16% (116) (22%)
Xbox 360ÏÏÏÏÏÏÏÏÏÏÏÏÏÏÏÏÏÏÏÏÏÏÏÏÏÏÏÏÏÏÏÏÏÏ 140 5% Ì Ì 140 N/M
Nintendo GameCubeÏÏÏÏÏÏÏÏÏÏÏÏÏÏÏÏÏÏÏÏÏÏÏÏ 135 5% 212 7% (77) (36%)
Other consoles ÏÏÏÏÏÏÏÏÏÏÏÏÏÏÏÏÏÏÏÏÏÏÏÏÏÏÏÏÏ 1 Ì 10 Ì (9) (90%)
Total Consoles ÏÏÏÏÏÏÏÏÏÏÏÏÏÏÏÏÏÏÏÏÏÏÏÏÏÏÏ 1,803 61% 2,068 66% (265) (13%)
PC ÏÏÏÏÏÏÏÏÏÏÏÏÏÏÏÏÏÏÏÏÏÏÏÏÏÏÏÏÏÏÏÏÏÏÏÏÏÏÏÏÏ 418 14% 531 17% (113) (21%)
Mobility
PSP ÏÏÏÏÏÏÏÏÏÏÏÏÏÏÏÏÏÏÏÏÏÏÏÏÏÏÏÏÏÏÏÏÏÏÏÏÏÏ 252 9% 18 1% 234 1,300%
Nintendo DSÏÏÏÏÏÏÏÏÏÏÏÏÏÏÏÏÏÏÏÏÏÏÏÏÏÏÏÏÏÏÏ 67 2% 23 1% 44 191%
Game Boy Advance and Game Boy Color ÏÏÏÏÏÏ 55 2% 77 2% (22) (29%)
Cellular HandsetsÏÏÏÏÏÏÏÏÏÏÏÏÏÏÏÏÏÏÏÏÏÏÏÏÏÏÏ 19 1% Ì Ì 19 N/M
Annual Report
Total MobilityÏÏÏÏÏÏÏÏÏÏÏÏÏÏÏÏÏÏÏÏÏÏÏÏÏÏÏÏ 393 14% 118 4% 275 233%
Co-publishing and DistributionÏÏÏÏÏÏÏÏÏÏÏÏÏÏÏÏÏÏ 213 7% 283 9% (70) (25%)
Internet Services, Licensing and Other
Subscription Services ÏÏÏÏÏÏÏÏÏÏÏÏÏÏÏÏÏÏÏÏÏÏÏÏ 61 2% 55 2% 6 11%
Licensing, Advertising and OtherÏÏÏÏÏÏÏÏÏÏÏÏÏÏ 63 2% 74 2% (11) (15%)
Total Internet Services, Licensing and Other ÏÏ 124 4% 129 4% (5) (4%)
Total Net RevenueÏÏÏÏÏÏÏÏÏÏÏÏÏÏÏÏÏÏÏÏÏÏÏÏÏÏÏÏ $2,951 100% $3,129 100% $(178) (6%)
PlayStation 2
For Ñscal 2006, net revenue from sales of titles for the PlayStation 2 was $1,127 million, driven primarily
by sales of Need for Speed Most Wanted, Madden NFL 06, FIFA 06, NCAA Football 06 and NBA
LIVE 06. We released 28 titles for the PlayStation 2 during Ñscal 2006, as compared to 27 titles in Ñscal
2005. Overall, PlayStation 2 net revenue decreased $203 million, or 15 percent, as compared to Ñscal 2005.
As noted above, we believe the transition to next-generation consoles adversely impacted our net revenue
from sales of titles for the PlayStation 2 in Ñscal 2006. We expect net revenue from sales of titles for the
41