Electronic Arts 2006 Annual Report Download - page 115
Download and view the complete annual report
Please find page 115 of the 2006 Electronic Arts annual report below. You can navigate through the pages in the report by either clicking on the pages listed below, or by using the keyword search tool below to find specific information within the annual report.-
 1
1 -
2
-
3
-
4
-
5
-
6
-
7
-
8
-
9
-
10
-
11
-
12
-
13
-
14
-
15
-
16
-
17
-
18
-
19
-
20
-
21
-
22
-
23
-
24
-
25
-
26
-
27
-
28
-
29
-
30
-
31
-
32
-
33
-
34
-
35
-
36
-
37
-
38
-
39
-
40
-
41
-
42
-
43
-
44
-
45
-
46
-
47
-
48
-
49
-
50
-
51
-
52
-
53
-
54
-
55
-
56
-
57
-
58
-
59
-
60
-
61
-
62
-
63
-
64
-
65
-
66
-
67
-
68
-
69
-
70
-
71
-
72
-
73
-
74
-
75
-
76
-
77
-
78
-
79
-
80
-
81
-
82
-
83
-
84
-
85
-
86
-
87
-
88
-
89
-
90
-
91
-
92
-
93
-
94
-
95
-
96
-
97
-
98
-
99
-
100
-
101
-
102
-
103
-
104
-
 105
105 -
 106
106 -
 107
107 -
 108
108 -
 109
109 -
 110
110 -
 111
111 -
 112
112 -
 113
113 -
 114
114 -
 115
115 -
 116
116 -
 117
117 -
 118
118 -
 119
119 -
 120
120 -
 121
121 -
 122
122 -
 123
123 -
 124
124 -
 125
125 -
126
-
127
-
128
-
129
-
130
-
131
-
132
-
133
-
134
-
135
-
136
-
137
-
138
-
139
-
140
-
141
-
142
-
143
-
144
-
145
-
146
-
147
-
148
-
149
-
150
-
151
-
152
-
153
-
154
-
155
-
156
-
157
-
158
-
159
-
160
-
161
-
162
-
163
-
164
-
165
-
166
-
167
-
168
-
169
-
170
-
171
-
172
-
173
-
174
-
175
-
176
-
177
-
178
-
179
-
180
-
181
-
182
-
183
-
184
-
185
-
186
-
187
-
188
-
189
-
190
-
191
-
192
-
193
-
194
-
195
-
196
 |
 |

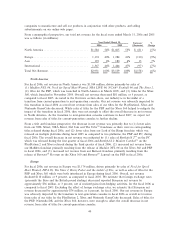
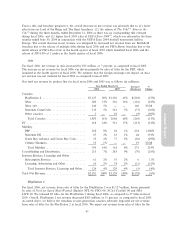
compared to 21 titles in Ñscal 2005. Overall, PC net revenue decreased $113 million, or 21 percent, as
compared to Ñscal 2005. The decrease was primarily due to (1) signiÑcantly higher Ñscal 2005 sales of
The Sims 2, (2) lower sales from our Medal of Honor
TM
franchise as there were no corresponding titles
released during Ñscal 2006, and (3) lower sales from our Lord of the Rings franchise. The overall decrease
in net revenue was mitigated by current-year sales of products from our BattleÑeld franchise. On
January 27, 2005, we began consolidating the Ñnancial results of Digital Illusion C.E. (a game
development company based in Sweden of which we are the majority owner) into our Ñnancial statements,
and, therefore, have characterized BattleÑeld 2 PC-based revenue as part of our PC product line. Prior to
consolidating DICE's Ñnancial results, we classiÑed revenue from the BattleÑeld franchise as co-publishing
and distribution revenue.
Mobile Platforms
Net revenue from mobile products Ì consisting of packaged goods games for handheld systems and
downloadable games for cellular handsets Ì increased from $118 million in Ñscal 2005 to $393 million in
Ñscal 2006. The increase was primarily due to sales of titles released in Ñscal 2006 for the PSP, and the
Nintendo DS, both of which were launched in Ñscal 2005 in certain countries. We released 16 titles for
the PSP during Ñscal 2006, as compared to three titles in Ñscal 2005. Overall, PSP net revenue increased
$234 million, driven primarily by sales of titles from our Need for Speed, FIFA, Burnout and Madden
franchises. We released ten titles for the Nintendo DS during Ñscal 2006, as compared to three titles in
Ñscal 2005. Nintendo DS net revenue increased $44 million, driven primarily by sales of titles from our
Need for Speed, The Sims and Madden franchises. The increase in PSP and Nintendo DS net revenue
was partially oÅset by lower sales of titles for the Game Boy Advance.
We expect mobile platform revenue to continue to increase in Ñscal 2007, driven primarily by anticipated
growth in our cellular handset games business.
Co-Publishing and Distribution
Net revenue from co-publishing and distribution products decreased from $283 million in Ñscal 2005 to
$213 million in Ñscal 2006. The decrease was primarily due to (1) the change in our classiÑcation of sales
of products from our BattleÑeld franchise, which, as discussed above, we no longer classify as co-
publishing and distribution revenue, and (2) overall higher Ñscal 2005 sales of various co-publishing and
distribution titles. The overall decrease in net revenue was mitigated by sales of Half-Life»2 in Ñscal
2006.
Subscription Services
Annual Report
Net revenue from subscription services increased from $55 million in Ñscal 2005 to $61 million in Ñscal
2006. The increase in net revenue was primarily due to an increase in the number of paying subscribers to
Club Pogo
TM
, partially oÅset by a decrease in net revenue from Ultima Online.
Licensing, Advertising and Other
Net revenue from licensing, advertising and other decreased from $74 million in Ñscal 2005 to $63 million
in Ñscal 2006. The decrease in net revenue was primarily due to Nokia N-Gage license revenue in Ñscal
2005.
Cost of Goods Sold
Cost of goods sold for our packaged-goods business consists of (1) product costs, (2) certain royalty
expenses for celebrities, professional sports and other organizations and independent software developers,
(3) manufacturing royalties, net of volume discounts and other vendor reimbursements, (4) expenses for
defective products, (5) write-oÅs of post-launch prepaid royalty costs, (6) amortization of certain
intangible assets, and (7) operations expenses. Volume discounts are generally recognized upon
achievement of milestones and vendor reimbursements are generally recognized as the related revenue is
43