Electronic Arts 2006 Annual Report Download - page 137
Download and view the complete annual report
Please find page 137 of the 2006 Electronic Arts annual report below. You can navigate through the pages in the report by either clicking on the pages listed below, or by using the keyword search tool below to find specific information within the annual report.-
 1
1 -
2
-
3
-
4
-
5
-
6
-
7
-
8
-
9
-
10
-
11
-
12
-
13
-
14
-
15
-
16
-
17
-
18
-
19
-
20
-
21
-
22
-
23
-
24
-
25
-
26
-
27
-
28
-
29
-
30
-
31
-
32
-
33
-
34
-
35
-
36
-
37
-
38
-
39
-
40
-
41
-
42
-
43
-
44
-
45
-
46
-
47
-
48
-
49
-
50
-
51
-
52
-
53
-
54
-
55
-
56
-
57
-
58
-
59
-
60
-
61
-
62
-
63
-
64
-
65
-
66
-
67
-
68
-
69
-
70
-
71
-
72
-
73
-
74
-
75
-
76
-
77
-
78
-
79
-
80
-
81
-
82
-
83
-
84
-
85
-
86
-
87
-
88
-
89
-
90
-
91
-
92
-
93
-
94
-
95
-
96
-
97
-
98
-
99
-
100
-
101
-
102
-
103
-
104
-
105
-
106
-
107
-
108
-
109
-
110
-
111
-
112
-
113
-
114
-
115
-
116
-
117
-
118
-
119
-
120
-
121
-
122
-
123
-
124
-
125
-
126
-
 127
127 -
 128
128 -
 129
129 -
 130
130 -
 131
131 -
 132
132 -
 133
133 -
 134
134 -
 135
135 -
 136
136 -
 137
137 -
 138
138 -
 139
139 -
 140
140 -
 141
141 -
 142
142 -
 143
143 -
 144
144 -
 145
145 -
 146
146 -
 147
147 -
148
-
149
-
150
-
151
-
152
-
153
-
154
-
155
-
156
-
157
-
158
-
159
-
160
-
161
-
162
-
163
-
164
-
165
-
166
-
167
-
168
-
169
-
170
-
171
-
172
-
173
-
174
-
175
-
176
-
177
-
178
-
179
-
180
-
181
-
182
-
183
-
184
-
185
-
186
-
187
-
188
-
189
-
190
-
191
-
192
-
193
-
194
-
195
-
196
 |
 |

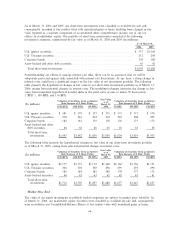
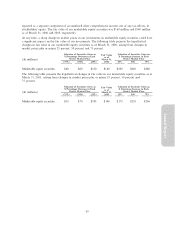
reported as a separate component of accumulated other comprehensive income, net of any tax eÅects, in
stockholders' equity. The fair value of our marketable equity securities was $160 million and $140 million
as of March 31, 2006 and 2005, respectively.
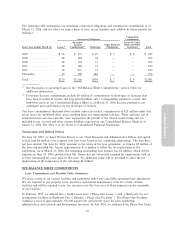
At any time, a sharp change in market prices in our investments in marketable equity securities could have
a signiÑcant impact on the fair value of our investments. The following table presents the hypothetical
changes in fair value in our marketable equity securities as of March 31, 2006, arising from changes in
market prices plus or minus 25 percent, 50 percent and 75 percent.
Valuation of Securities Given an Valuation of Securities Given an
Fair Value
X Percentage Decrease in Each X Percentage Increase in Each
as of
Stock's Market Price Stock's Market Price
March 31,(In millions) (75%) (50%) (25%) 2006 25% 50% 75%
Marketable equity securities ÏÏ $40 $80 $120 $160 $200 $240 $280
The following table presents the hypothetical changes in fair value in our marketable equity securities as of
March 31, 2005, arising from changes in market prices plus or minus 25 percent, 50 percent and
75 percent.
Valuation of Securities Given an Valuation of Securities Given an
Fair Value
X Percentage Decrease in Each X Percentage Increase in Each
as of
Stock's Market Price Stock's Market Price
March 31,(In millions) (75%) (50%) (25%) 2005 25% 50% 75%
Marketable equity securities ÏÏ $35 $70 $105 $140 $175 $210 $246
Annual Report
65